Anatomy of the Ransomware Market: A Crime That Works Like Clockwork
An empirical investigation into 25,680 global ransomware leak site disclosures and 168 negotiation archives (2020-2025), revealing the corporate economics, publication rhythms, and negotiation dynamics of modern cyber extortion.

Author’s Note & Publication Context
This research was originally conducted and published in Czech as part of the ALEF Security Report 2026. To share these empirical findings with the broader international cybersecurity community, this dedicated English edition is now being released.Temporal Scope Notice: The underlying telemetry, threat actor statistics, and negotiation dynamics presented in this study reflect the state of the cyber extortion ecosystem as documented during the original research timeframe (spanning January 2020 through December 2025, with negotiation telemetry analyzed through early 2026). The figures represent a closed, historical analytical cohort rather than real-time, live-streamed intelligence.
Anatomy of the Ransomware Market: A Crime That Works Like Clockwork
Ransomware is today one of the biggest fears for corporate management, IT departments, and regulators alike. Virtually every organization now operates with the assumption that the question is no longer if, but when. Despite this, public debate often revolves around individual media-friendly incidents rather than data. How fast is ransomware really growing? How many groups actually control it? And are their attacks just random attempts, or a calculated business?
This analysis is based on roughly 25,680 publicly published victim records on leak sites between January 2020 and December 2025. The data comes from the ransomware.live project, founded and maintained by Julien Mousqueton, which operates as an open aggregator tracking Data Leak Sites (DLS), media mentions, and related telemetry.
Given the nature of the source data, information on individual incidents may not always be complete, and records from leak sites obviously do not cover every ransomware attack that occurred worldwide. Each part of this analysis therefore works strictly with records where valid information is available for the given topic.
1. Data Overview & Methodology
The observation period is bounded by the years 2020 to 2025. Prior to 2020, the dataset contained only a limited number of records insufficient for longer-term comparisons, while the end of 2025 provides a natural cutoff for closing annual statistics.
The defined dataset contains 24,545 publicly published records from ransomware leak sites across 272 groups, 185 countries, and 59 sectors. In addition to primary fields such as group name, publication date, country, and sector, the dataset also includes victim domains, indicators of potential prior infostealer compromise, media coverage links, and source references.
Several caveats must be taken into account: some attributes are not populated consistently. In particular, sector and country contain a higher proportion of unknown values. Sector classifications also had to be normalized due to changes over time within the dataset. Furthermore, the identity of ransomware groups is not static: actors change names, groups dissolve, merge, or rebrand, which can affect the interpretation of long-term trends. Each section of the analysis therefore works strictly with data points available for that specific area.
2. Year-over-Year Evolution: Dynamics of Published Incidents
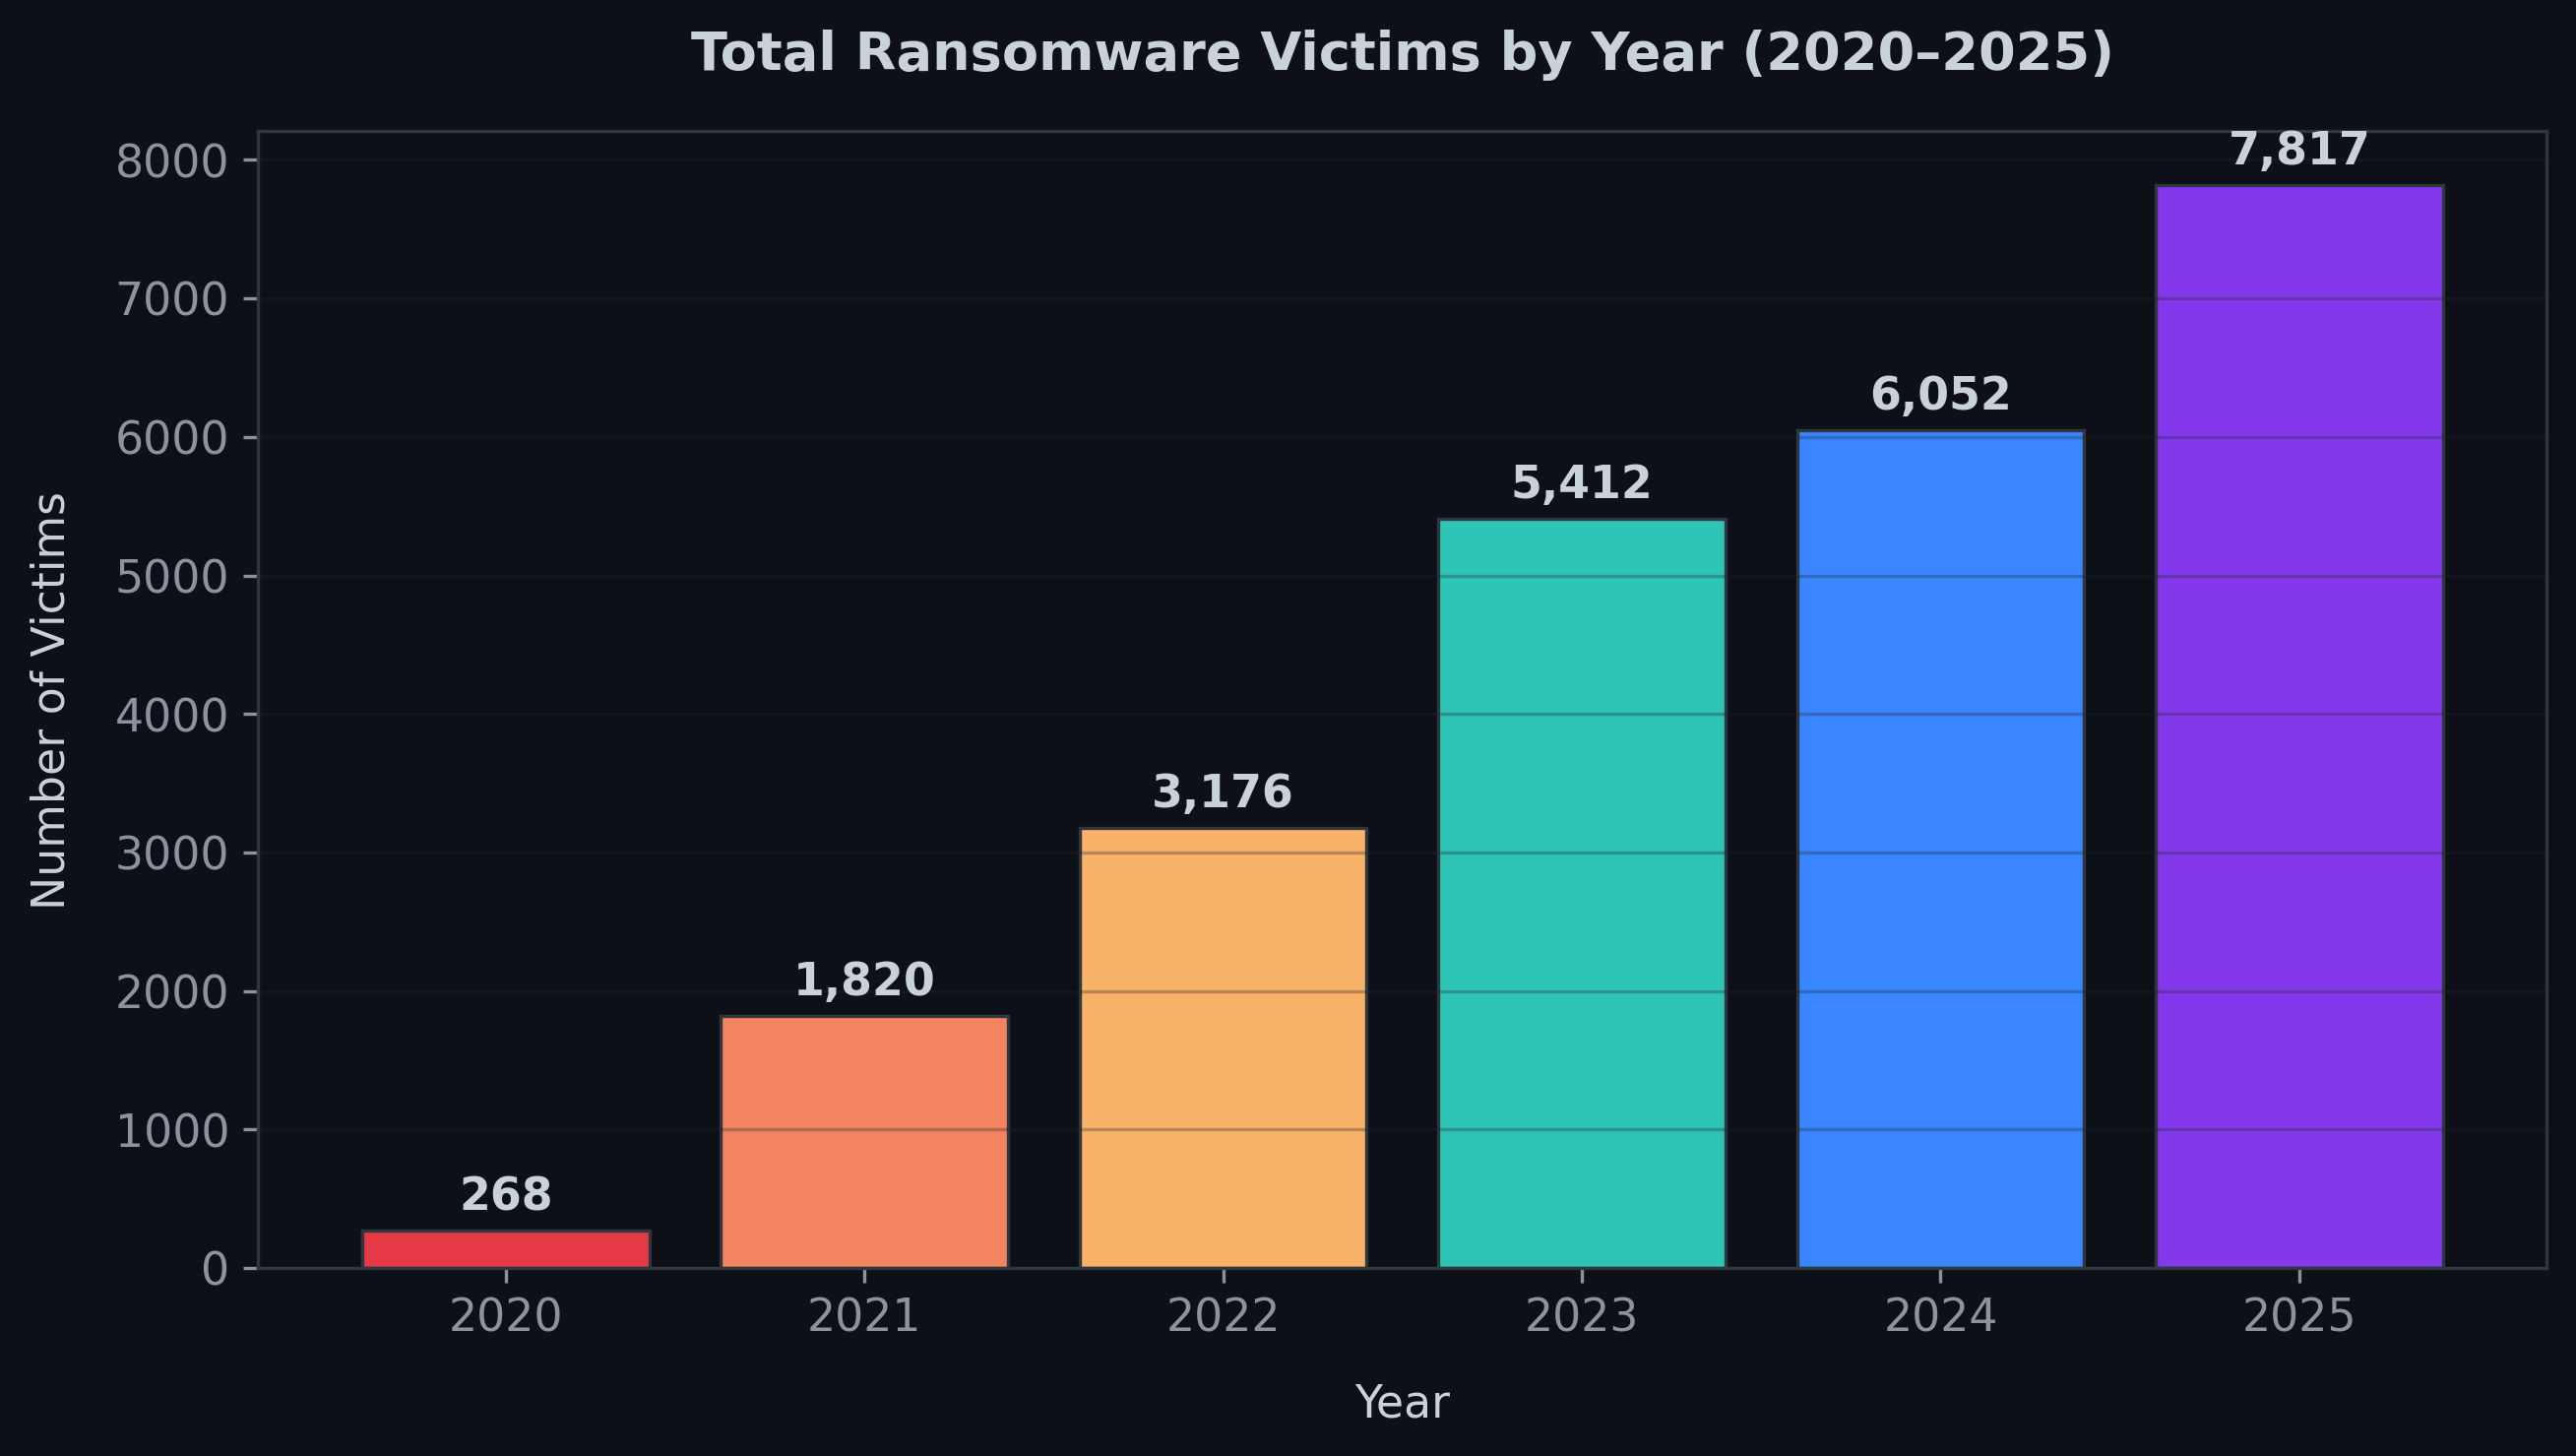
Between 2020 and 2025, the number of published victims grew every year. From 268 cases in 2020, claims surged to 1,820 in 2021, representing the steepest relative jump across the entire period (+579.1%). Growth continued in 2022 with 3,176 cases (+74.5%) and climbed to 5,412 in 2023 (+70.4%). While YoY growth slowed in 2024 (+11.8%), total volume reached 6,052. The year 2025 set an all-time high with 7,817 claimed victims (+29.2%). The data shows an industry steadily scaling up, not a temporary spike.
3. Seasonality: Does a Ransomware Season Exist?
Looking at monthly averages across the data reveals that while ransomware operates continuously year-round, distinct seasonal fluctuations emerge. May and the summer months consistently dip below the multi-year monthly average of 341 victims per month. Conversely, starting in September, extortion activity accelerates, peaking in November and December.
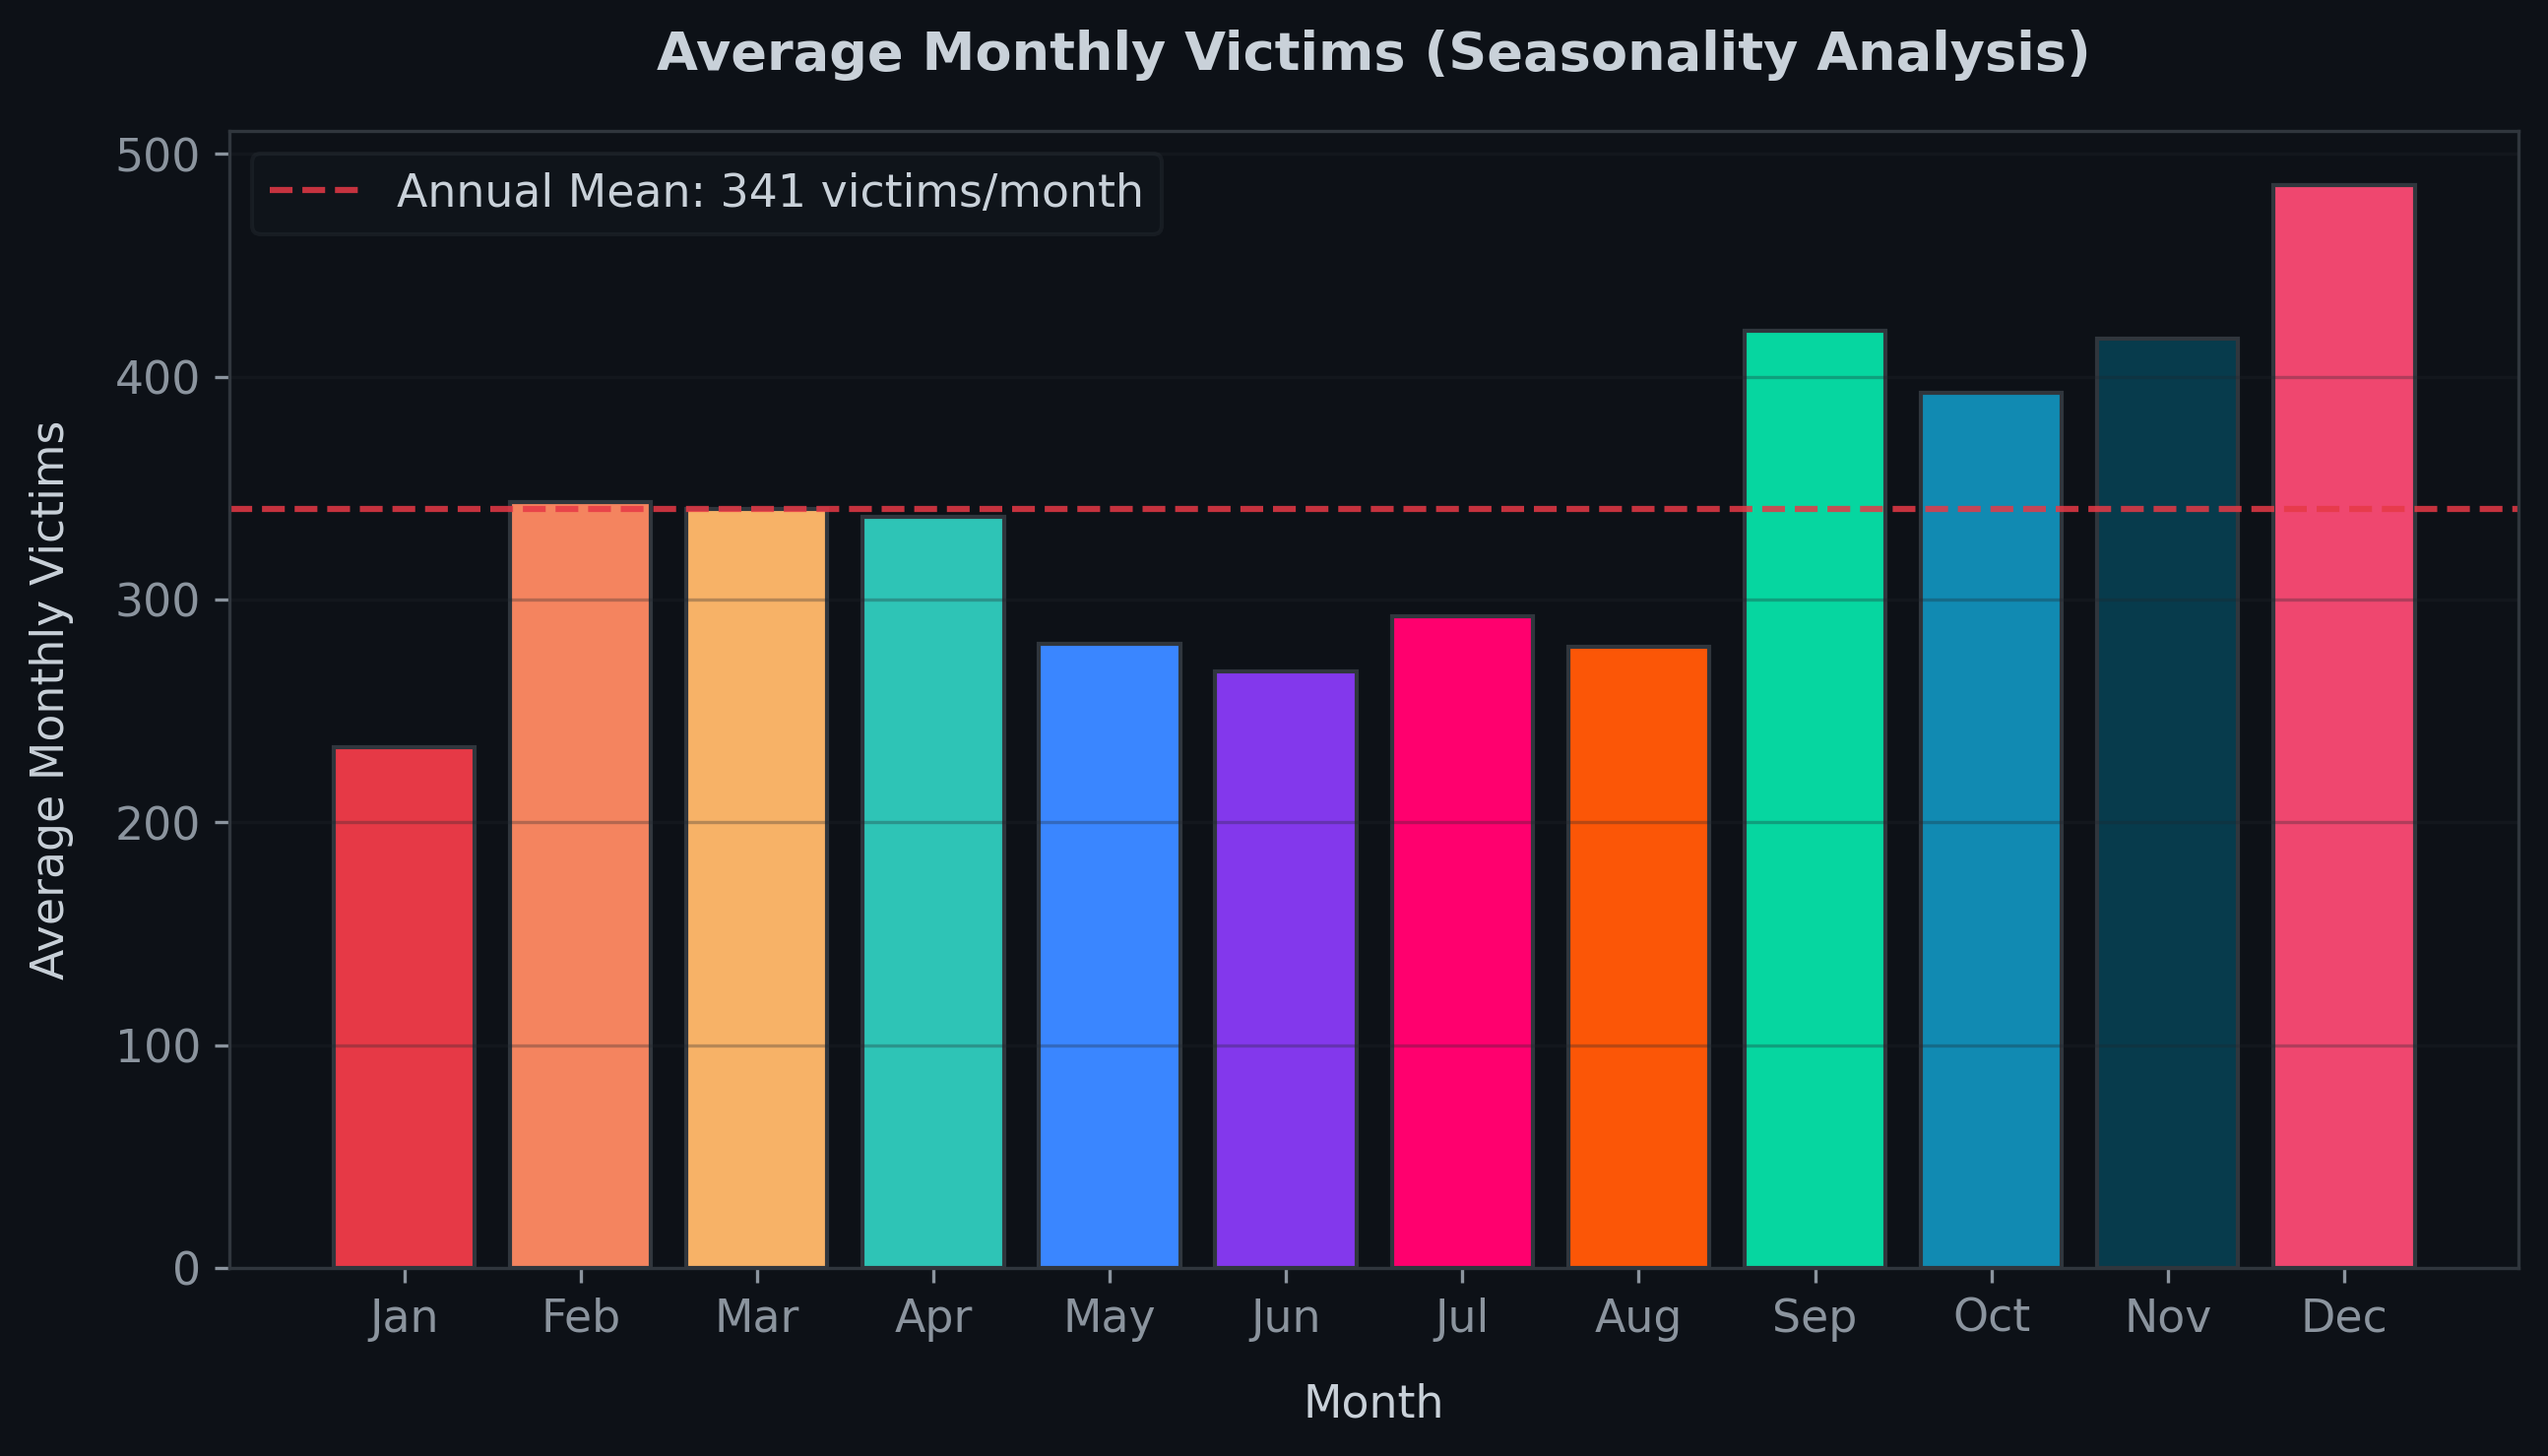
The metrics alone do not explain why, but they suggest several practical explanations. Summer brings a slowdown on both sides: corporate teams run on skeleton holiday staffing, and criminal crews reduce their operational tempo too. In contrast, year-end operations involve tight fiscal deadlines, critical project deliverables, and heavy commercial traffic. Over the holidays, defensive alertness can also face fatigue. From a risk management perspective, the second half of the calendar year, especially Q4, represents an elevated exposure window.
4. Nine to Five: Just on the Wrong Side of the Law
The distribution of published incidents by day of the week shows a clear pattern. The highest numbers of published victims fall on business days, peaking on Thursdays. Weekends, on the other hand, are noticeably quieter: Saturday and Sunday record roughly half the volume of peak weekdays.
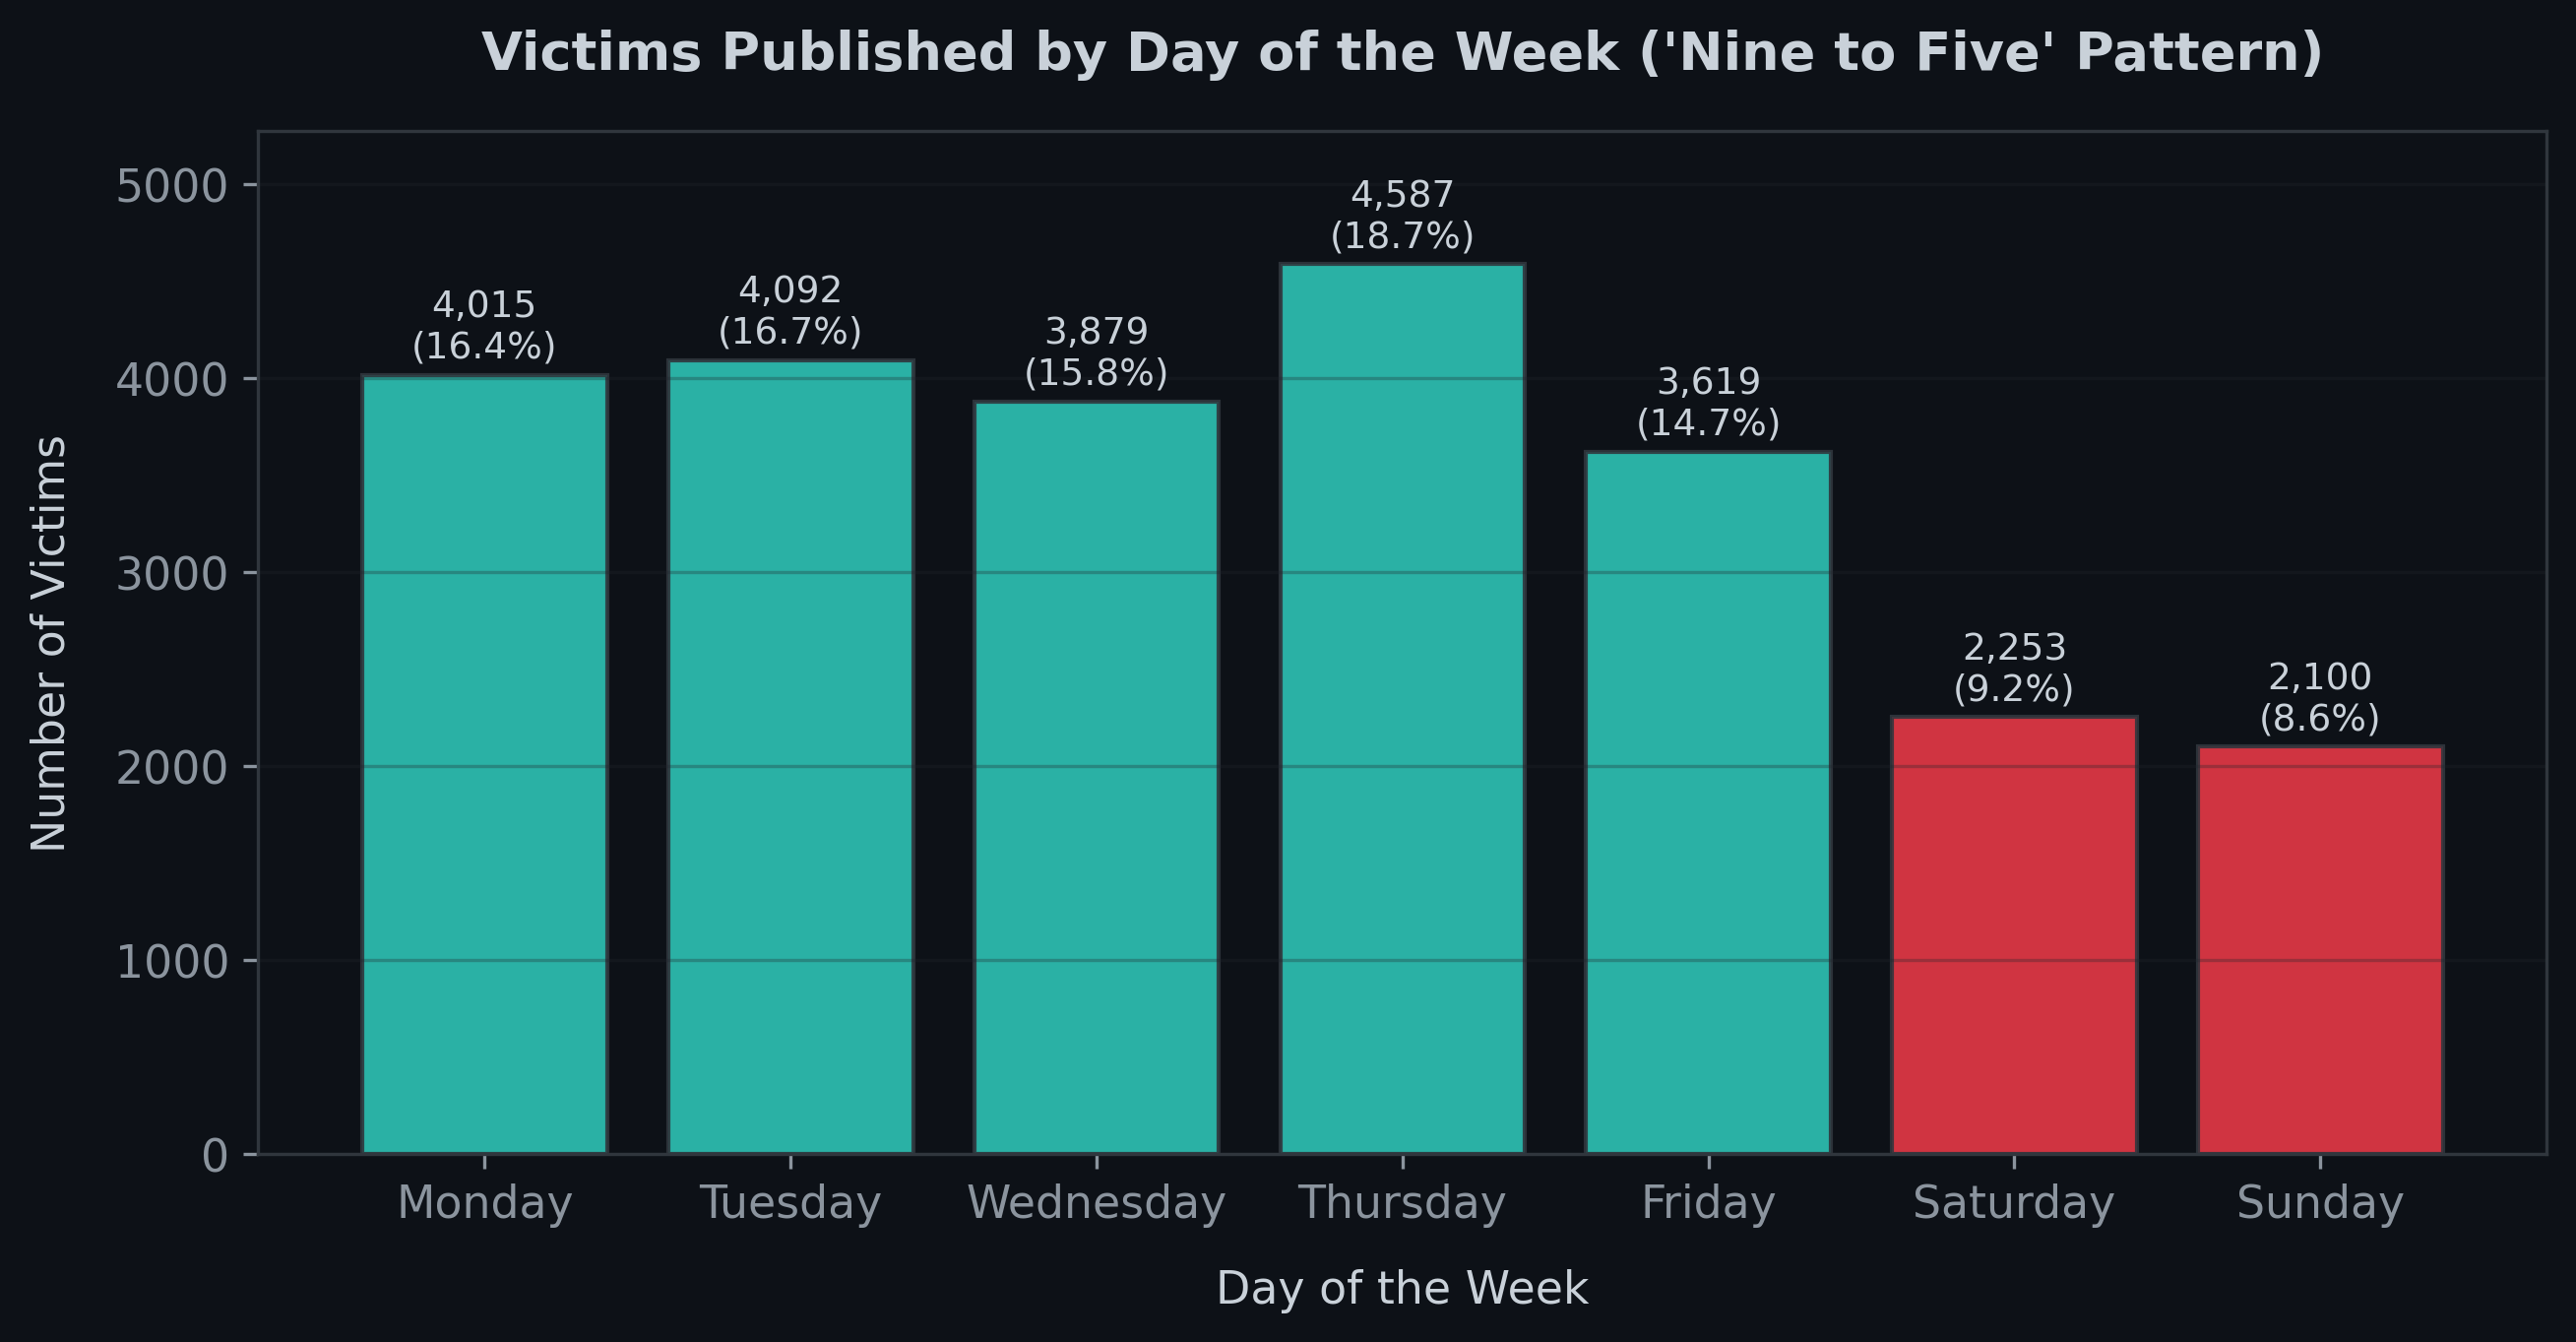
This pattern suggests that leak site disclosures occur primarily in business hours. This may reflect the internal organizational structure of the groups themselves, as well as tactical timing: publishing on a weekday increases the chance that the incident lands immediately on the desks of decision-makers and journalists.
Interestingly, weekends do not show higher publication counts, despite what might be expected from reduced security team availability on non-working days. The data instead shows disclosures following standard working hours. This pattern indicates that ransomware groups operate more like structured organizations with their own operational rhythm than random, chaotic crews.
5. Who Pulls the Strings of the Ransomware Economy?
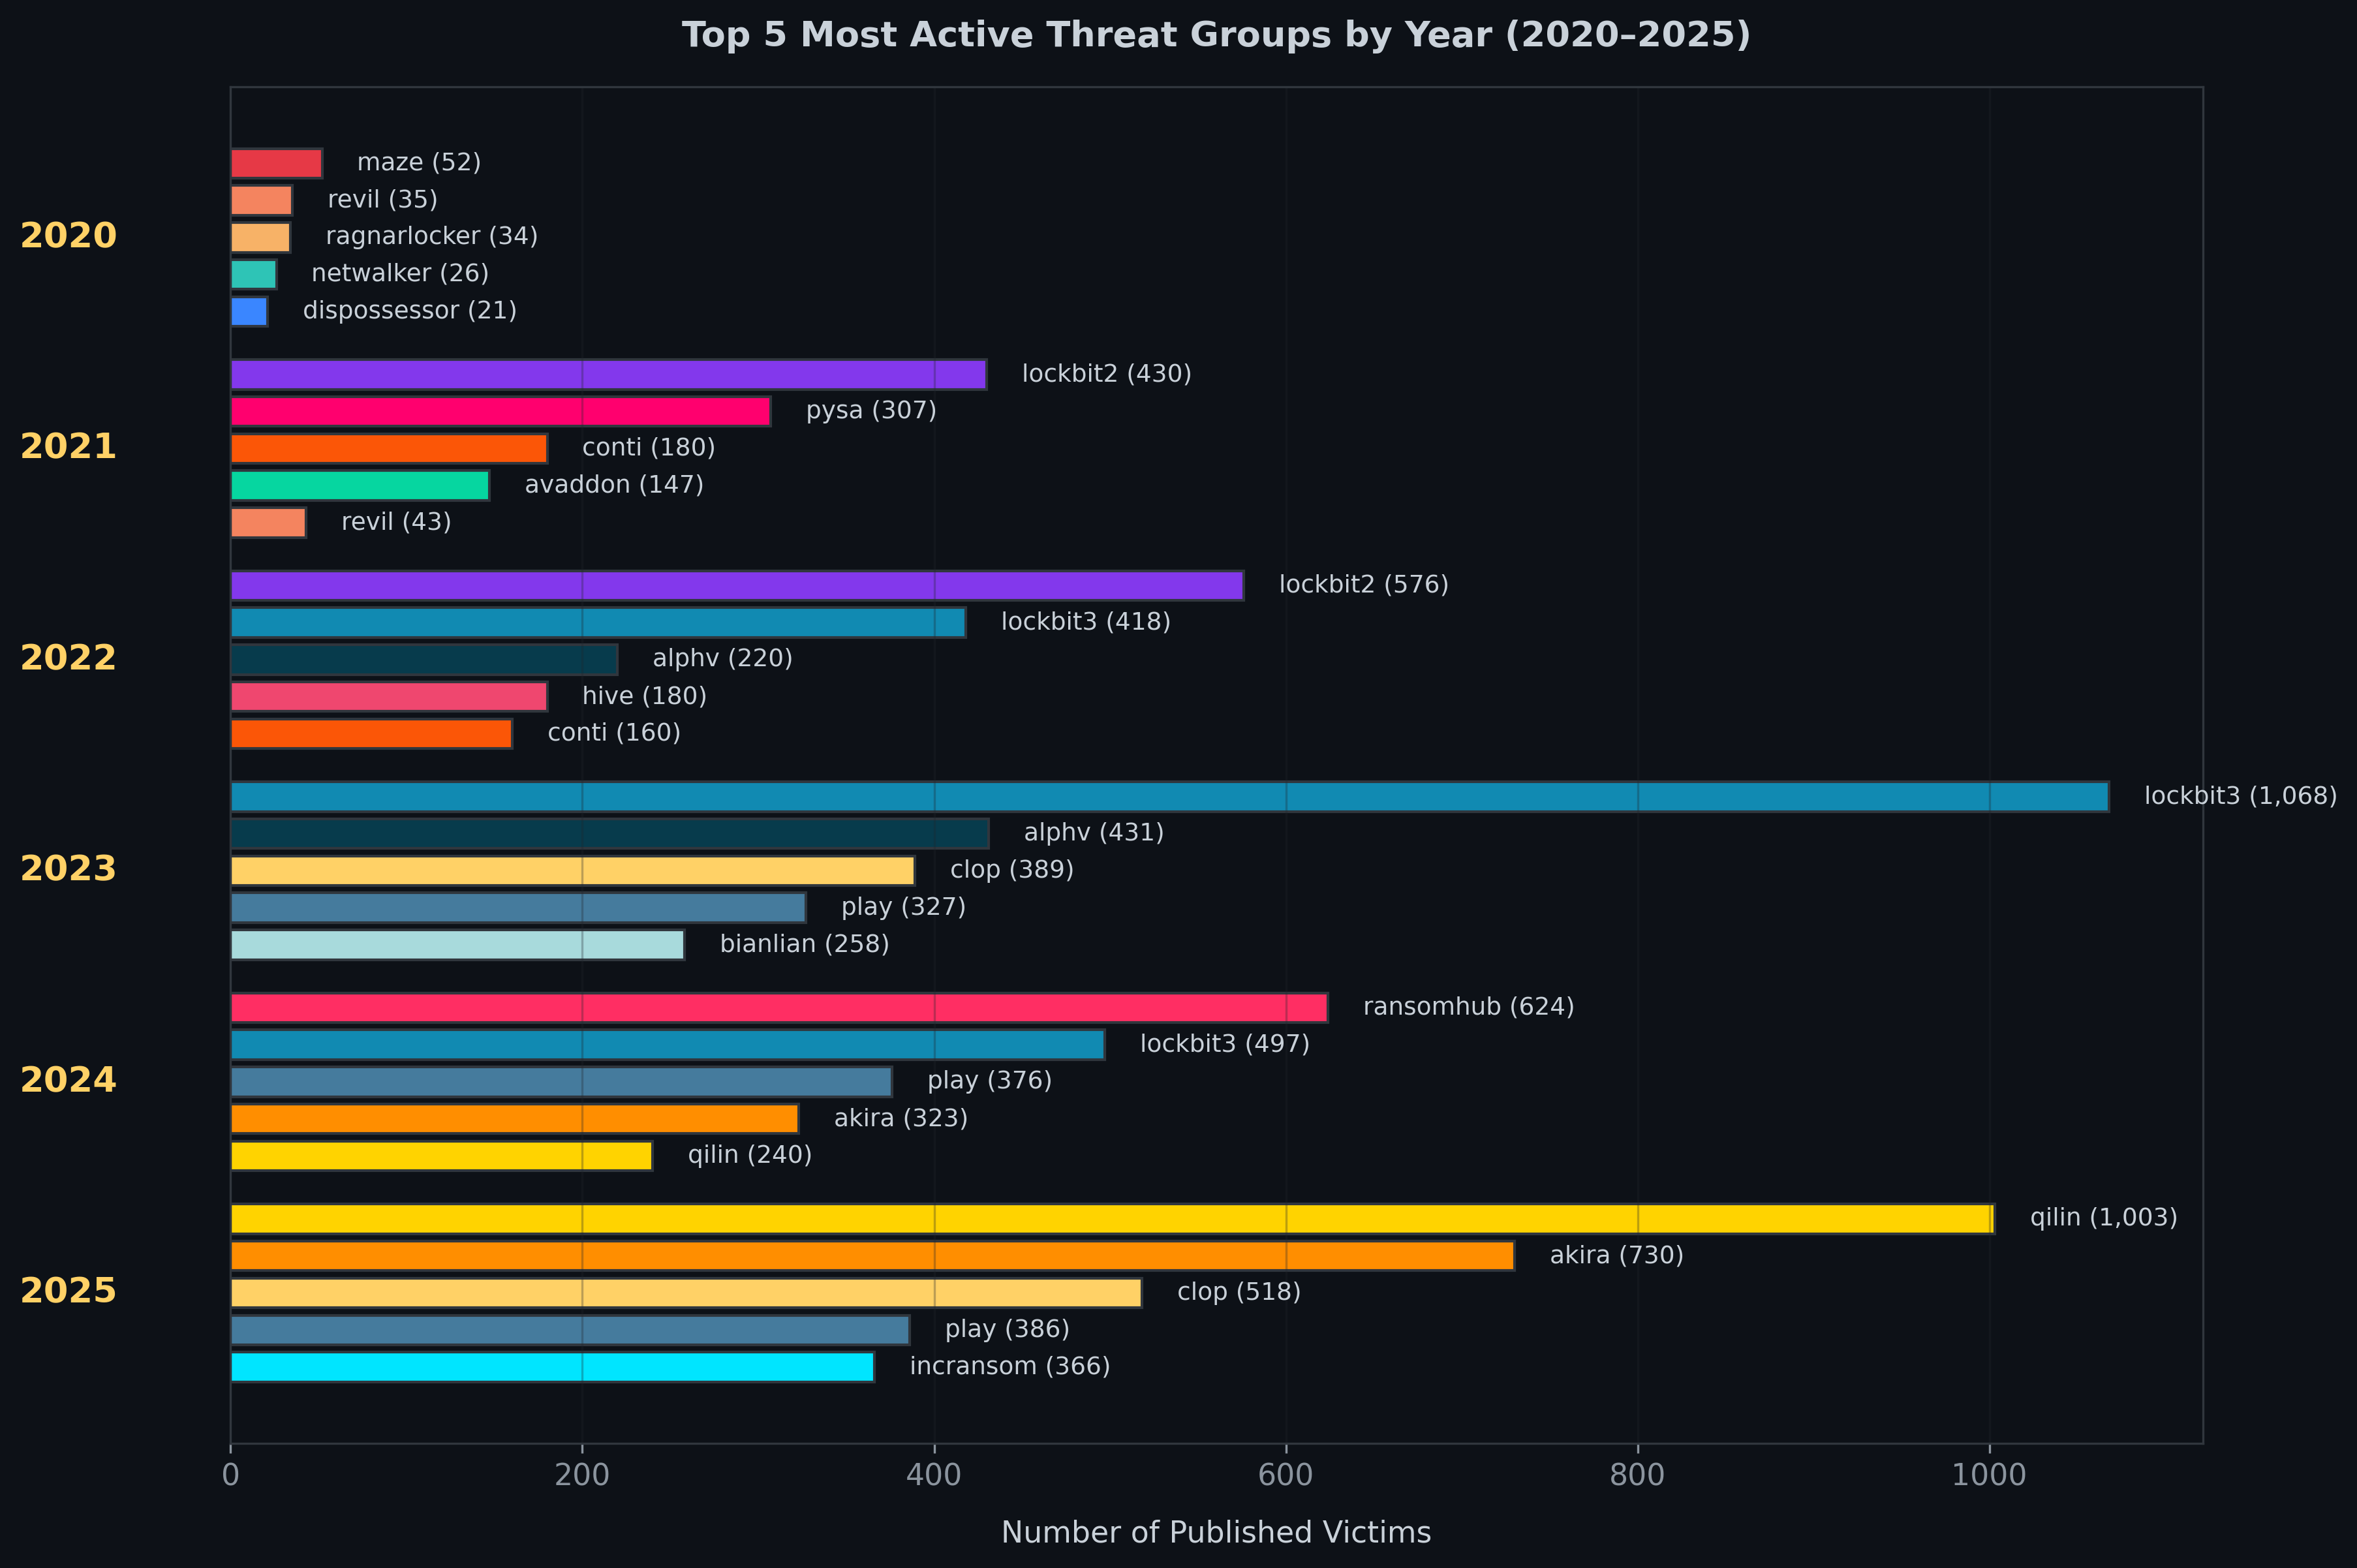
First, looking at the top 25 groups by total published victims shows heavy concentration. Historically, the highest victim count belongs to LockBit (predominantly the LockBit 3.0 version), which far exceeds other actors. At the same time, newer names like Qilin and Akira have entered the ranks of the most active players.
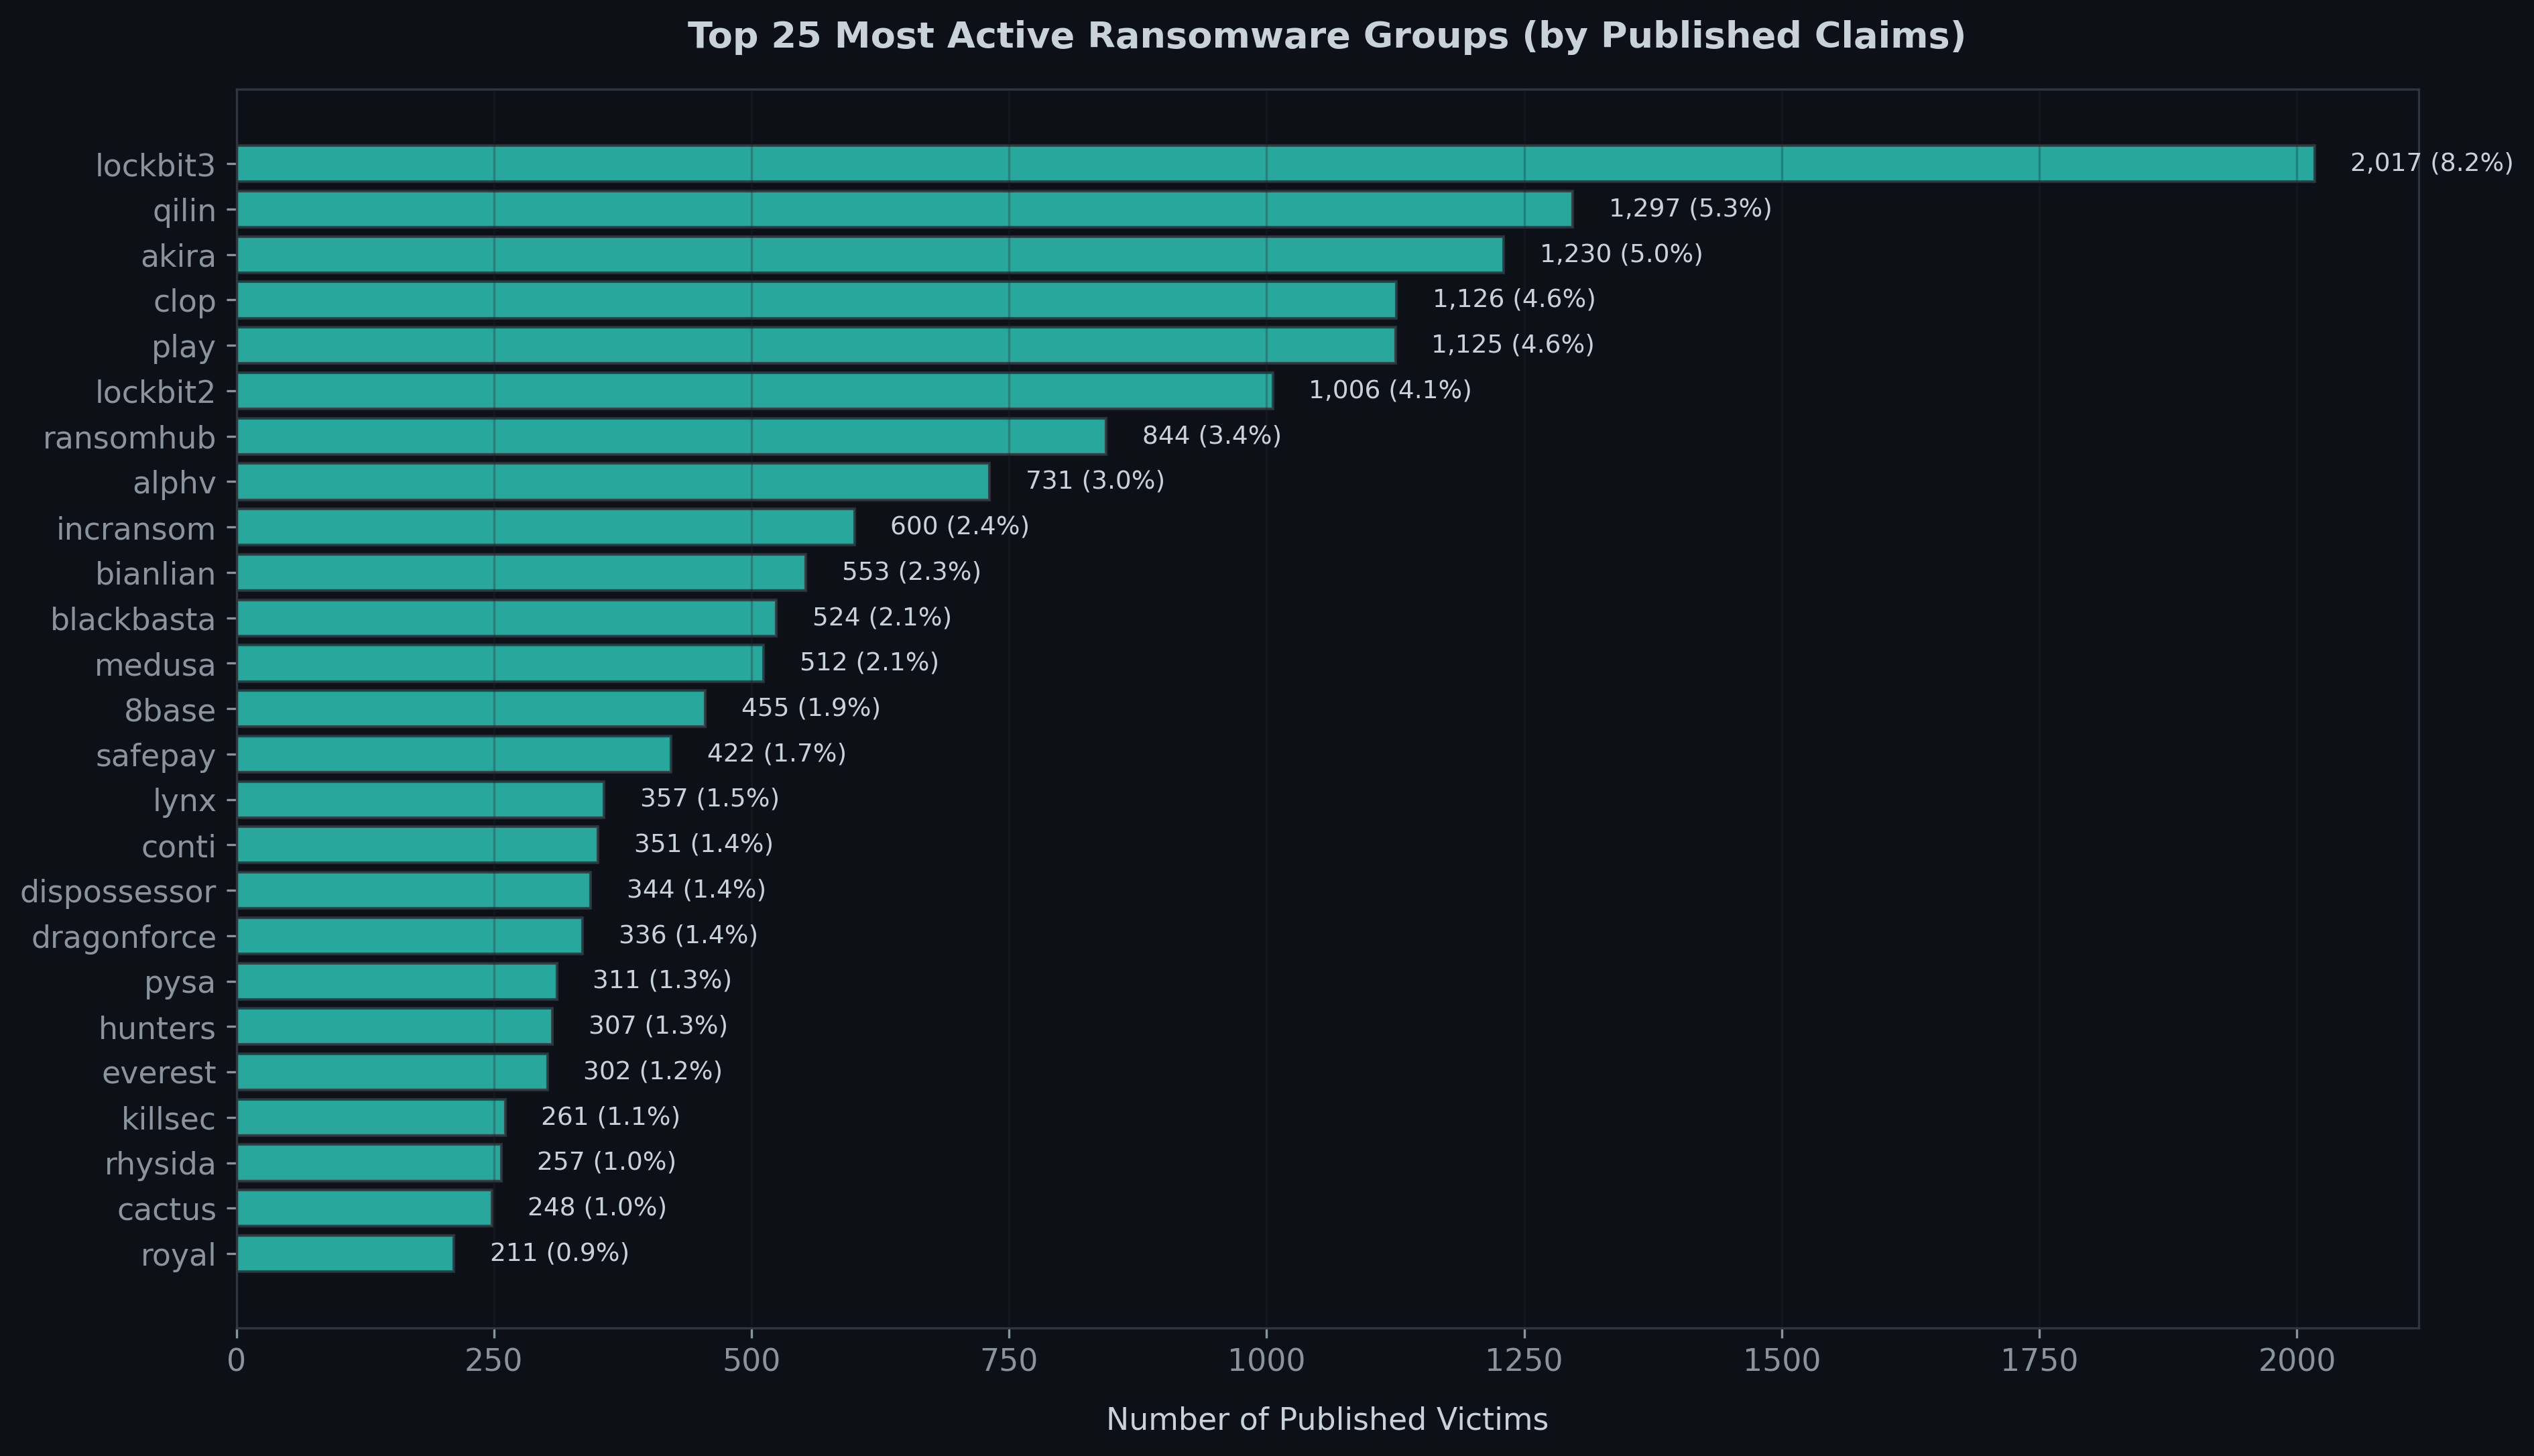
A better view of group activity comes from examining the most active players year by year. While LockBit clearly dominated earlier years, it was replaced by other ransomware groups in recent years due to international law enforcement pressure and infrastructure disruptions.
The cumulative count of tracked ransomware groups between 2020 and 2025 shows steady and uninterrupted growth. New groups enter the logs continuously, and the total count of unique actors increases over time without sustained stagnation.
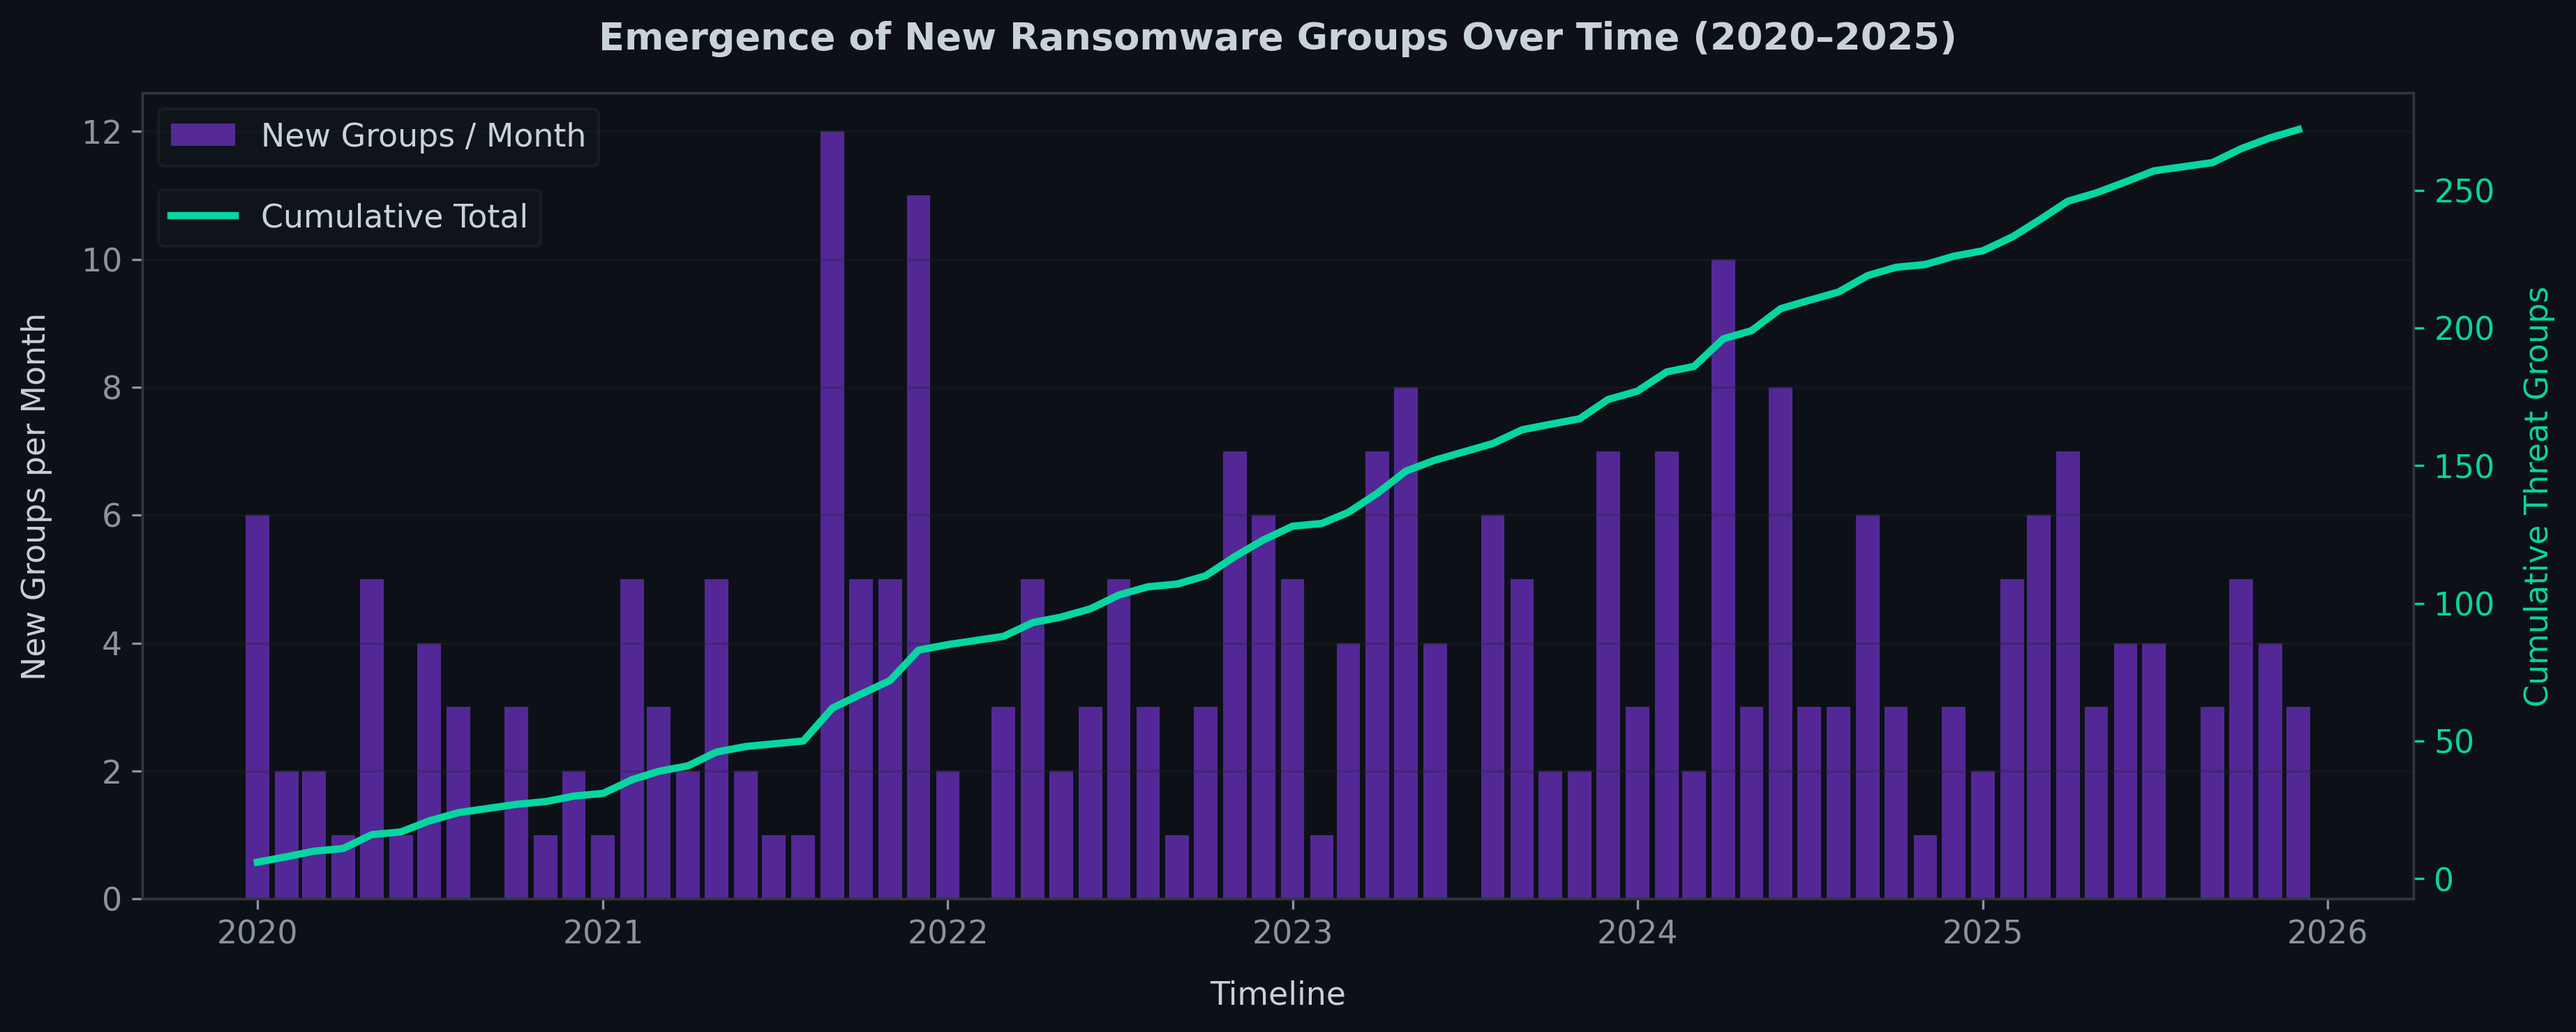
However, this growth does not mean that all groups remain active long-term. Many appear for only a limited period, after which their activity subsides. The ecosystem does not grow simply by accumulating permanent players, but through continuous turnover: new groups enter, while others disappear or rebrand. This confirms that the ransomware environment is dynamic and adaptive.
The operational timeline of the top 35 groups illustrates this clearly. Individual dots represent published victims over time, while horizontal bars show the active lifespan of each group in the data.
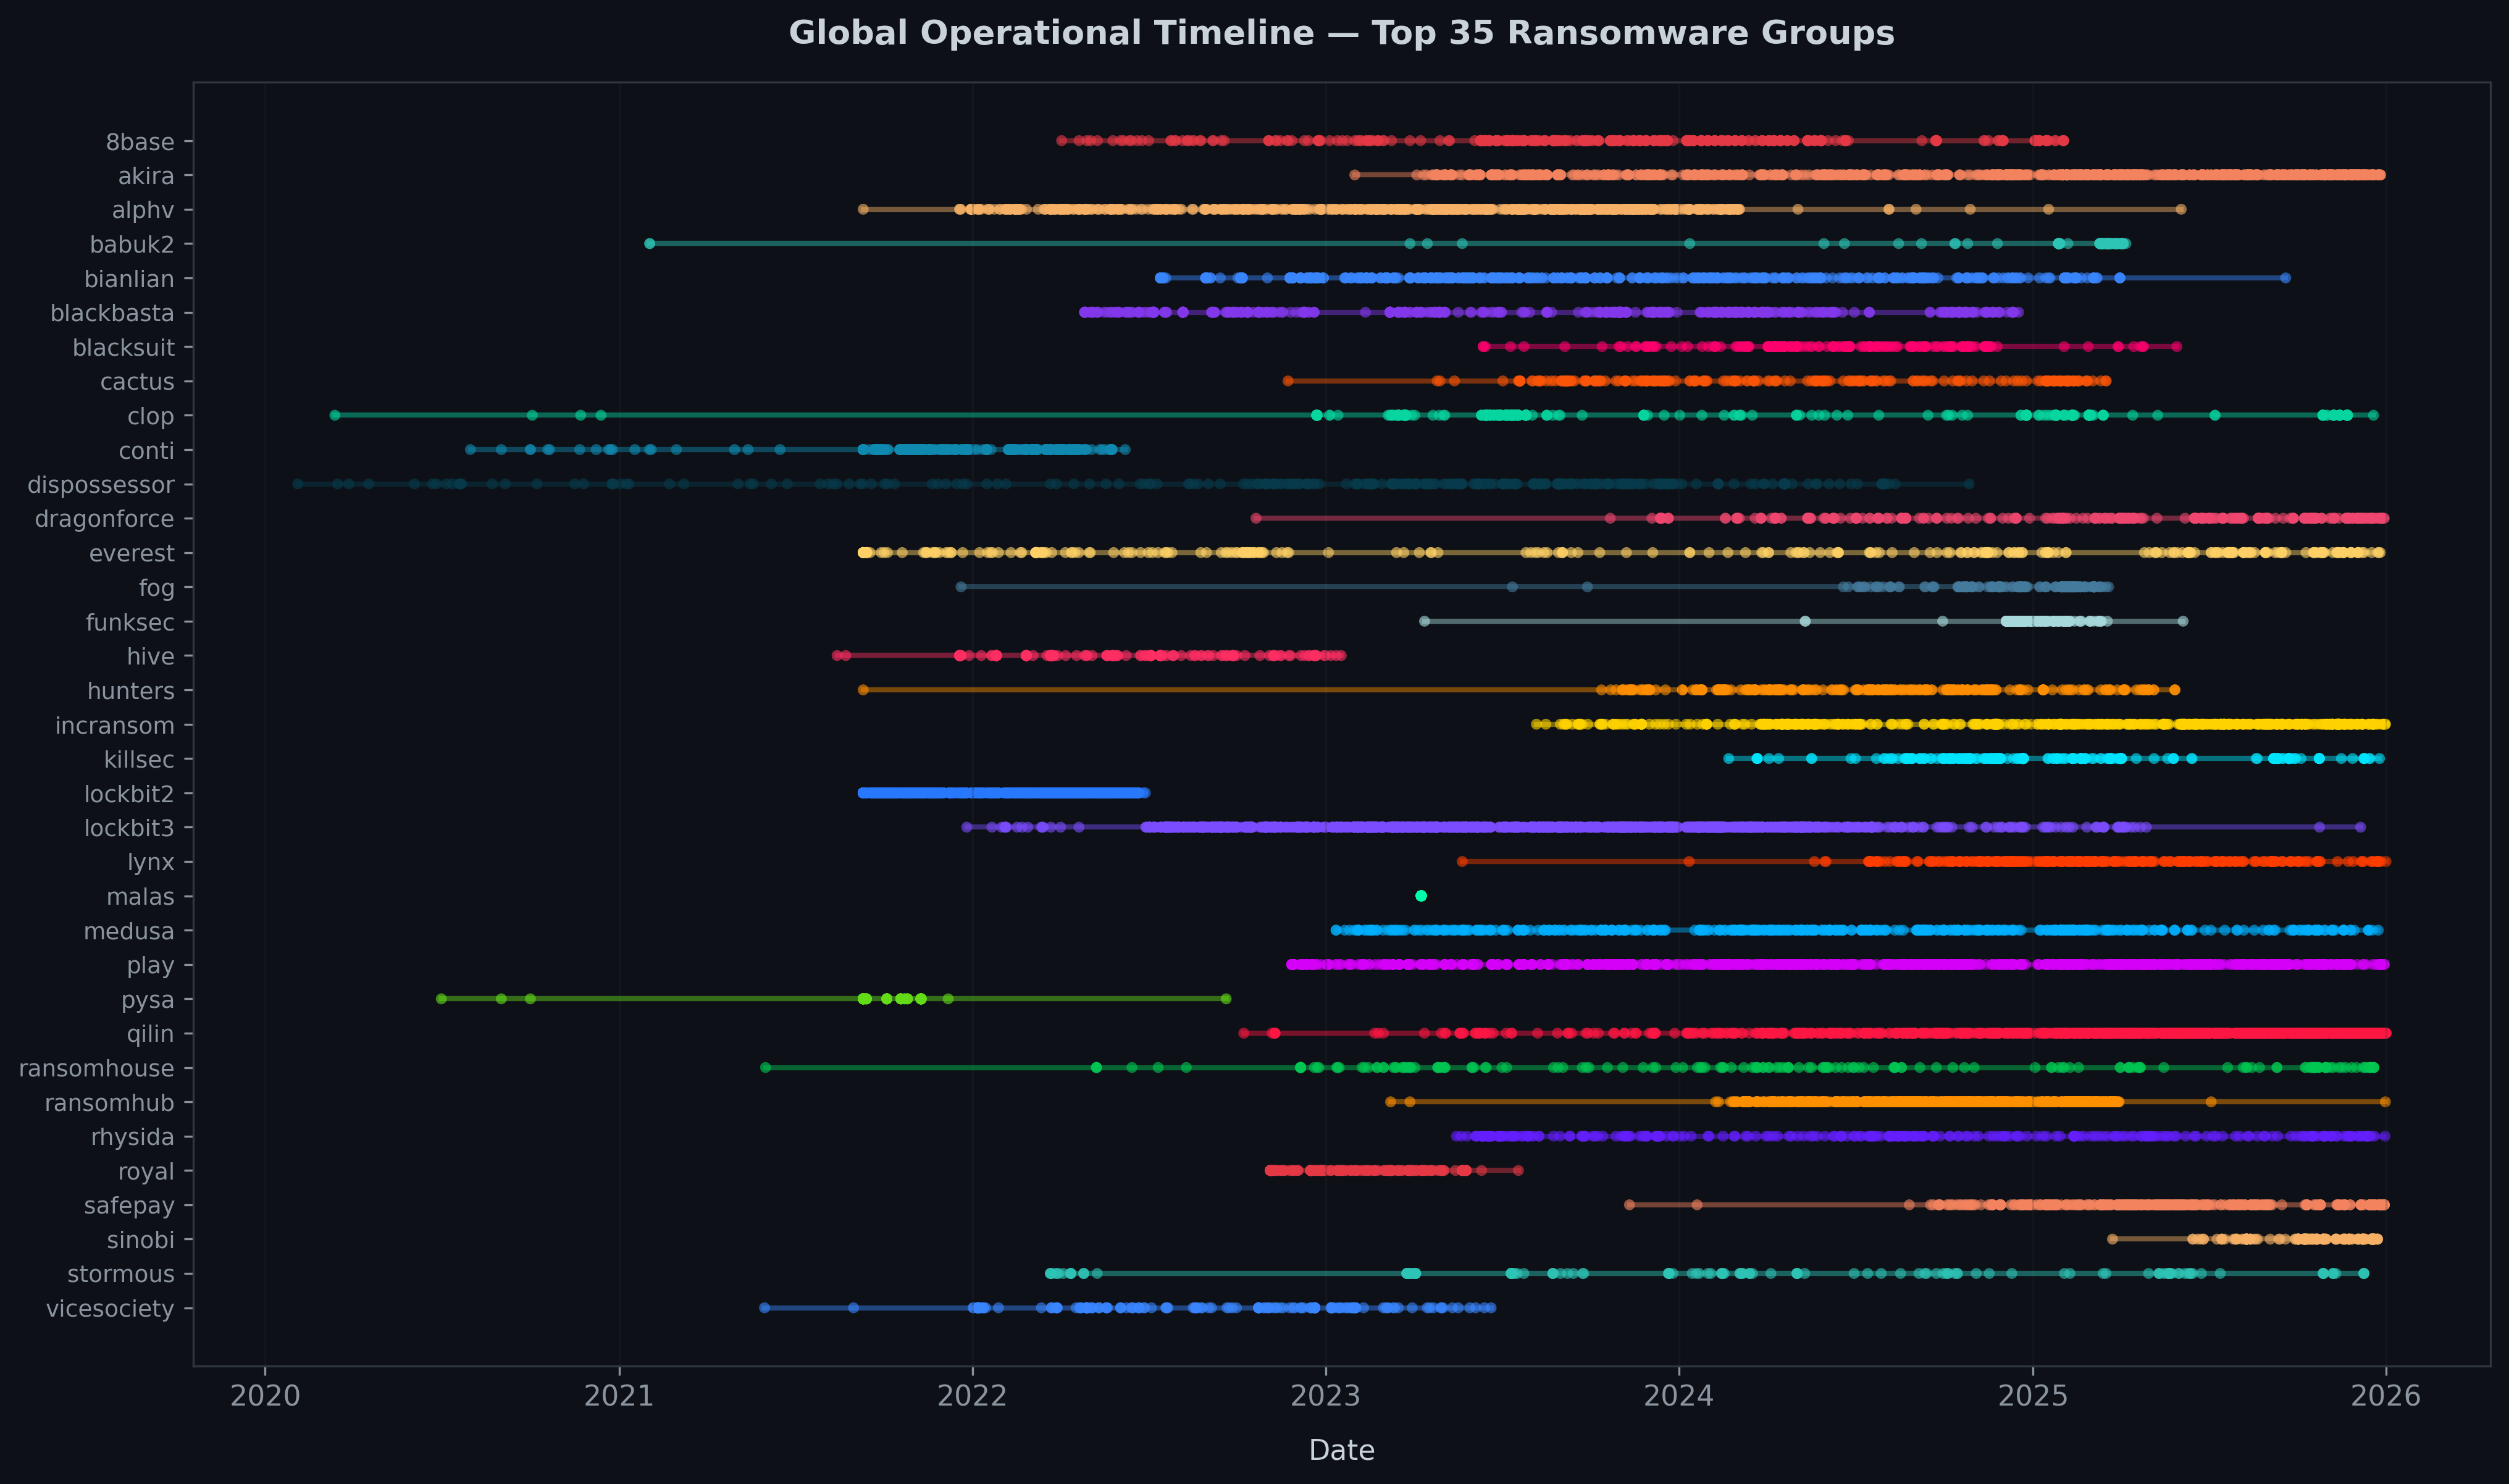
Several major players were heavily active in the past, but show little or no activity in subsequent periods. This does not necessarily mean their members stopped operating, but under that specific moniker, their footprint fades or ends. We also observe changes related to infrastructure upgrades, rebranding, internal conflicts, or law enforcement actions. Examples include the transition from LockBit 2.0 to 3.0, the internal collapse of Conti following the leak of its chats in 2022, and the seizure of Hive’s infrastructure in 2023.
Activity is heavily concentrated. The 80% threshold of all published victims is reached only after counting almost all groups. The four most active groups (roughly 1.5% of all groups) alone account for more than 23% of all victims.
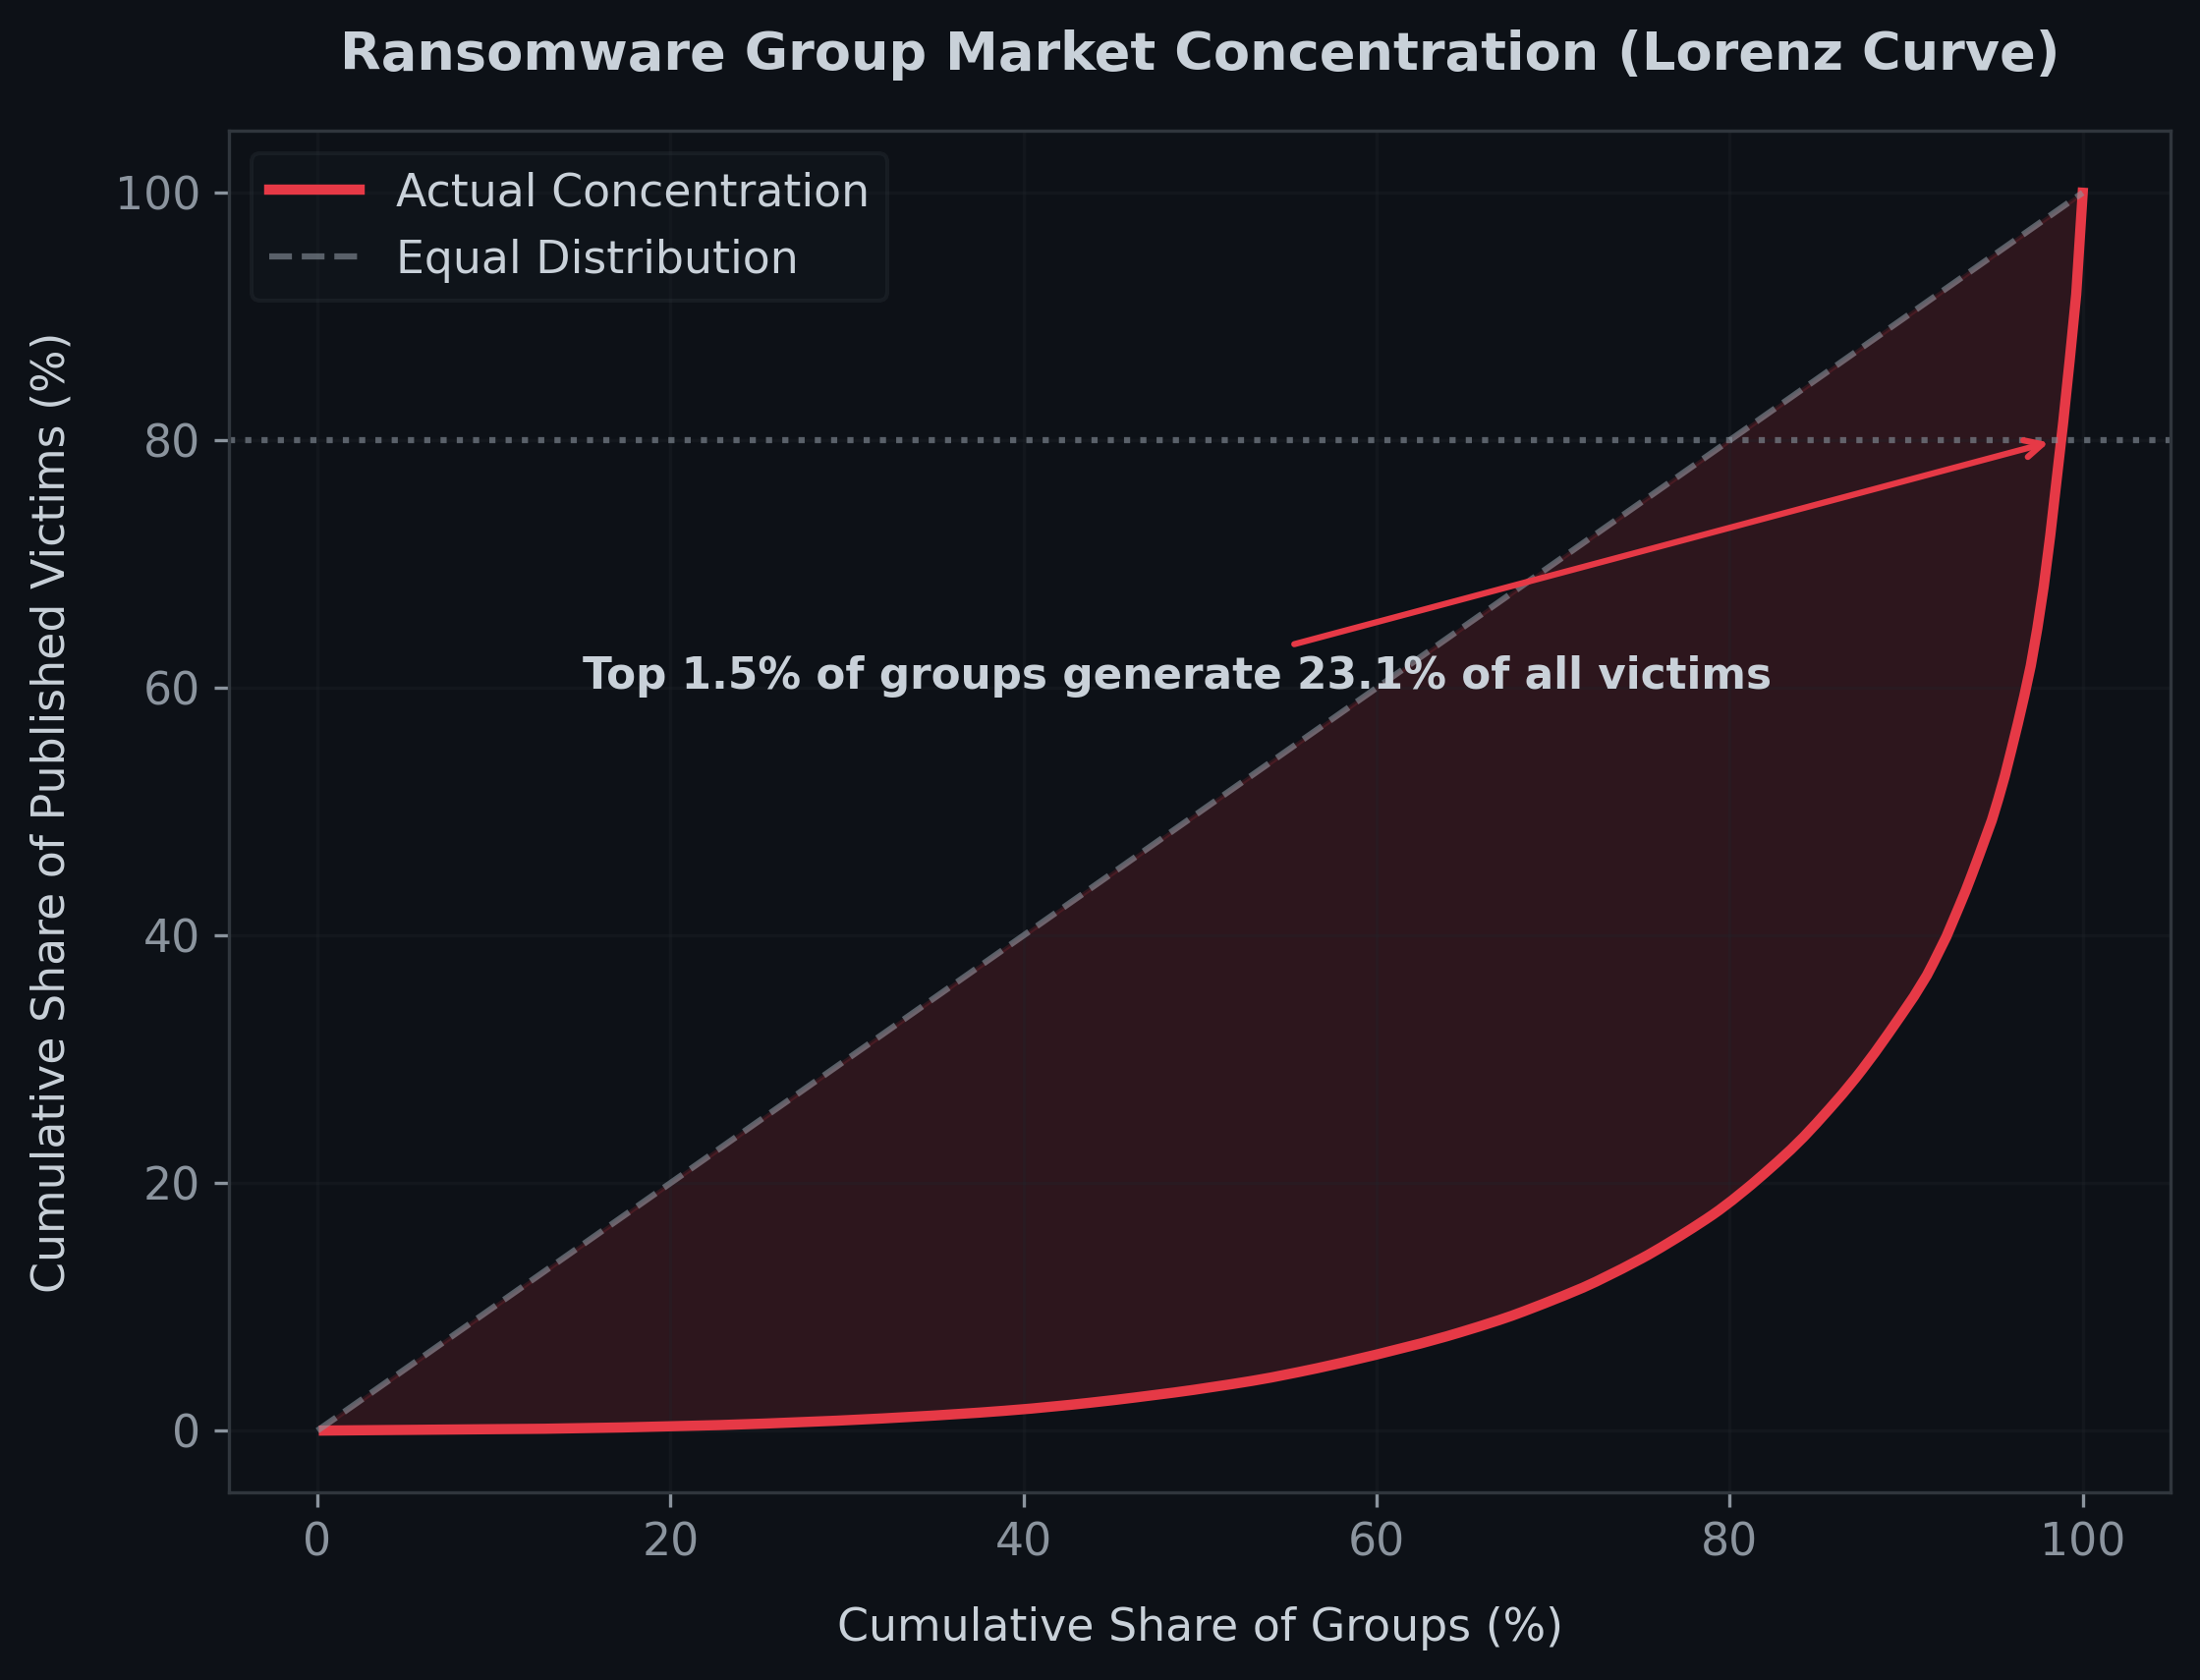
The horizontal axis shows the cumulative percentage of ransomware groups, ranked from least to most active, while the vertical axis shows their cumulative share of published victims. The dashed diagonal represents an ideal state where every group would have an equal share of victims. The actual curve diverges sharply from this line: the vast majority of groups generate only a small share of victims, while a small circle of heavy hitters produces most of the volume.
A strategic view of group behavior combines three key dimensions: geographic reach (how many countries a group impacts), attack velocity (monthly victim count), and total volume of activity (bubble size).
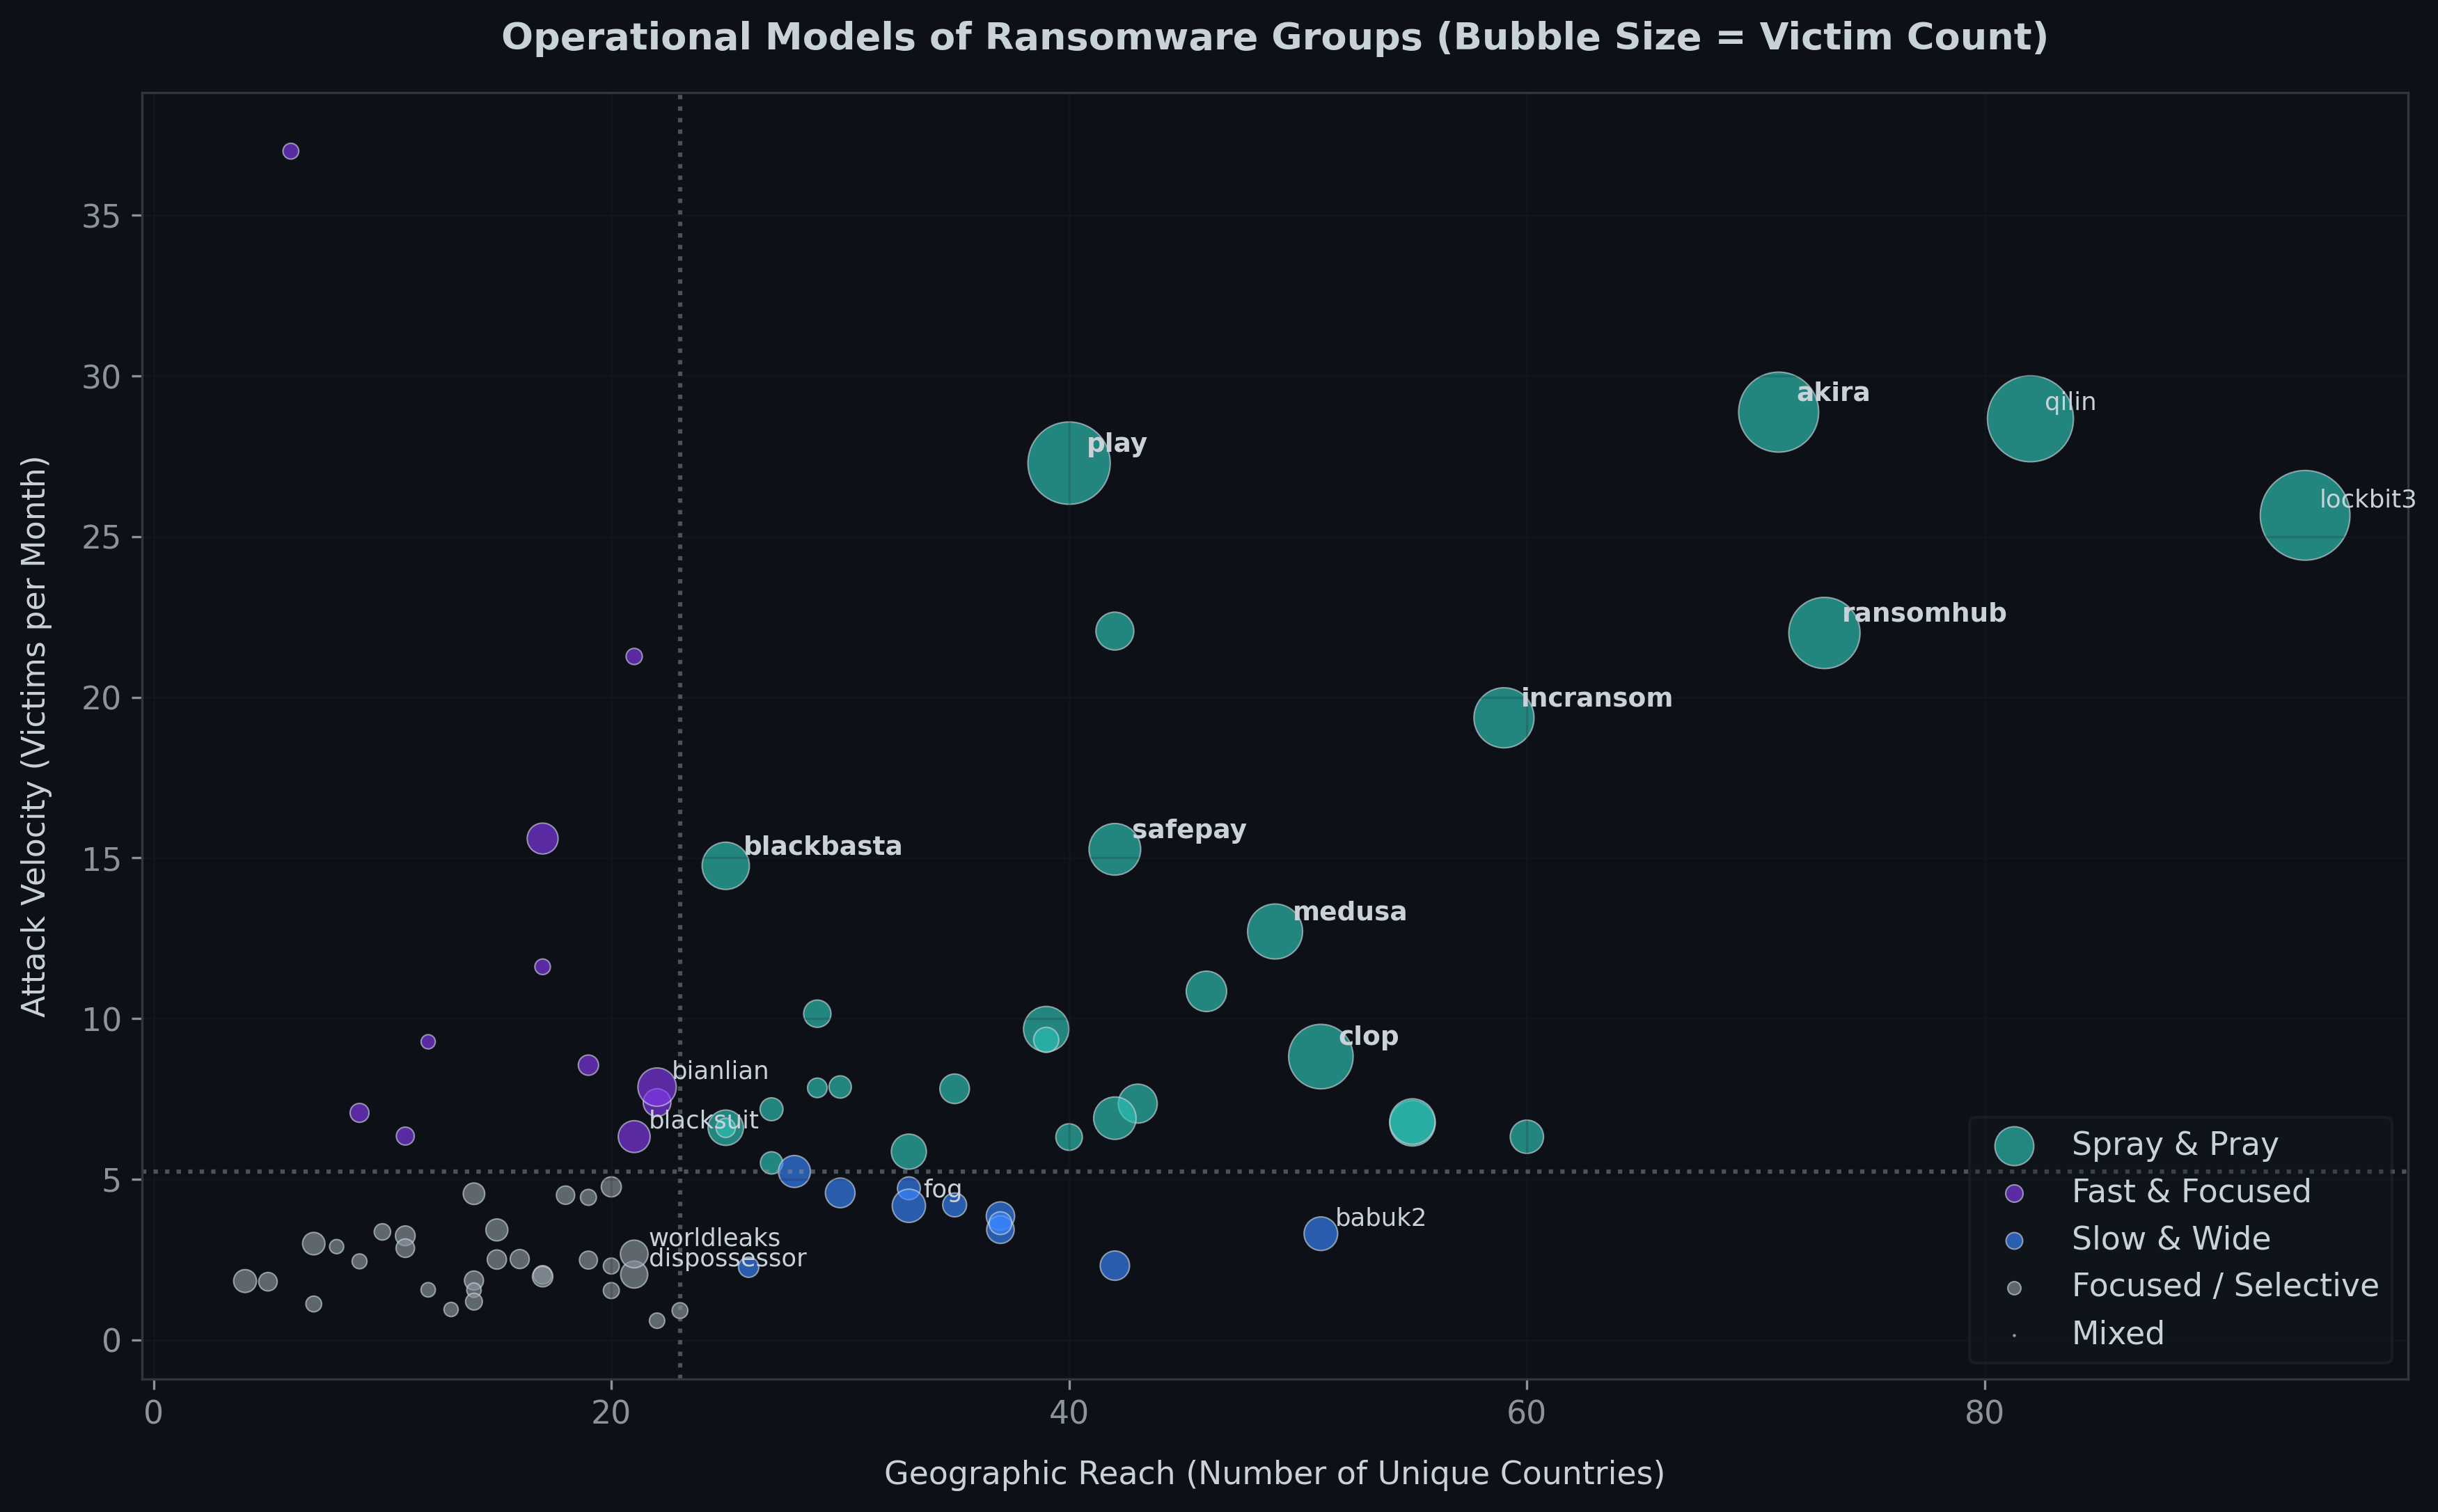
The upper-right quadrant represents the most aggressive model, with high speed and broad geographic impact (Spray and Pray). Most dominant players fall here, such as LockBit 3.0, Qilin, and Akira. These groups operate globally, work continuously, and generate high victim counts.
On the other end of the spectrum are groups with limited reach and lower cadence (Focused / Selective), which may be regionally focused, temporary, or more selective in choosing targets. The Slow and Wide category captures long-standing actors with broader reach but lower monthly intensity, while Fast and Focused represents rapid campaigns often tied to a specific opportunity or vulnerability.
Overall, the chart shows that the market structure is far from uniform: a clearly defined group of high-output global players leads the field, while the rest of the ecosystem consists of smaller, less stable, or specialized operations.
6. Who Is Most in the Crosshairs?
The overview of most targeted countries shows strong US dominance: the United States accounts for 44.2% of all incidents with known country attribution (and 27.9% of the gross dataset), followed at a distance by Canada, the United Kingdom, Germany, France, and Italy.
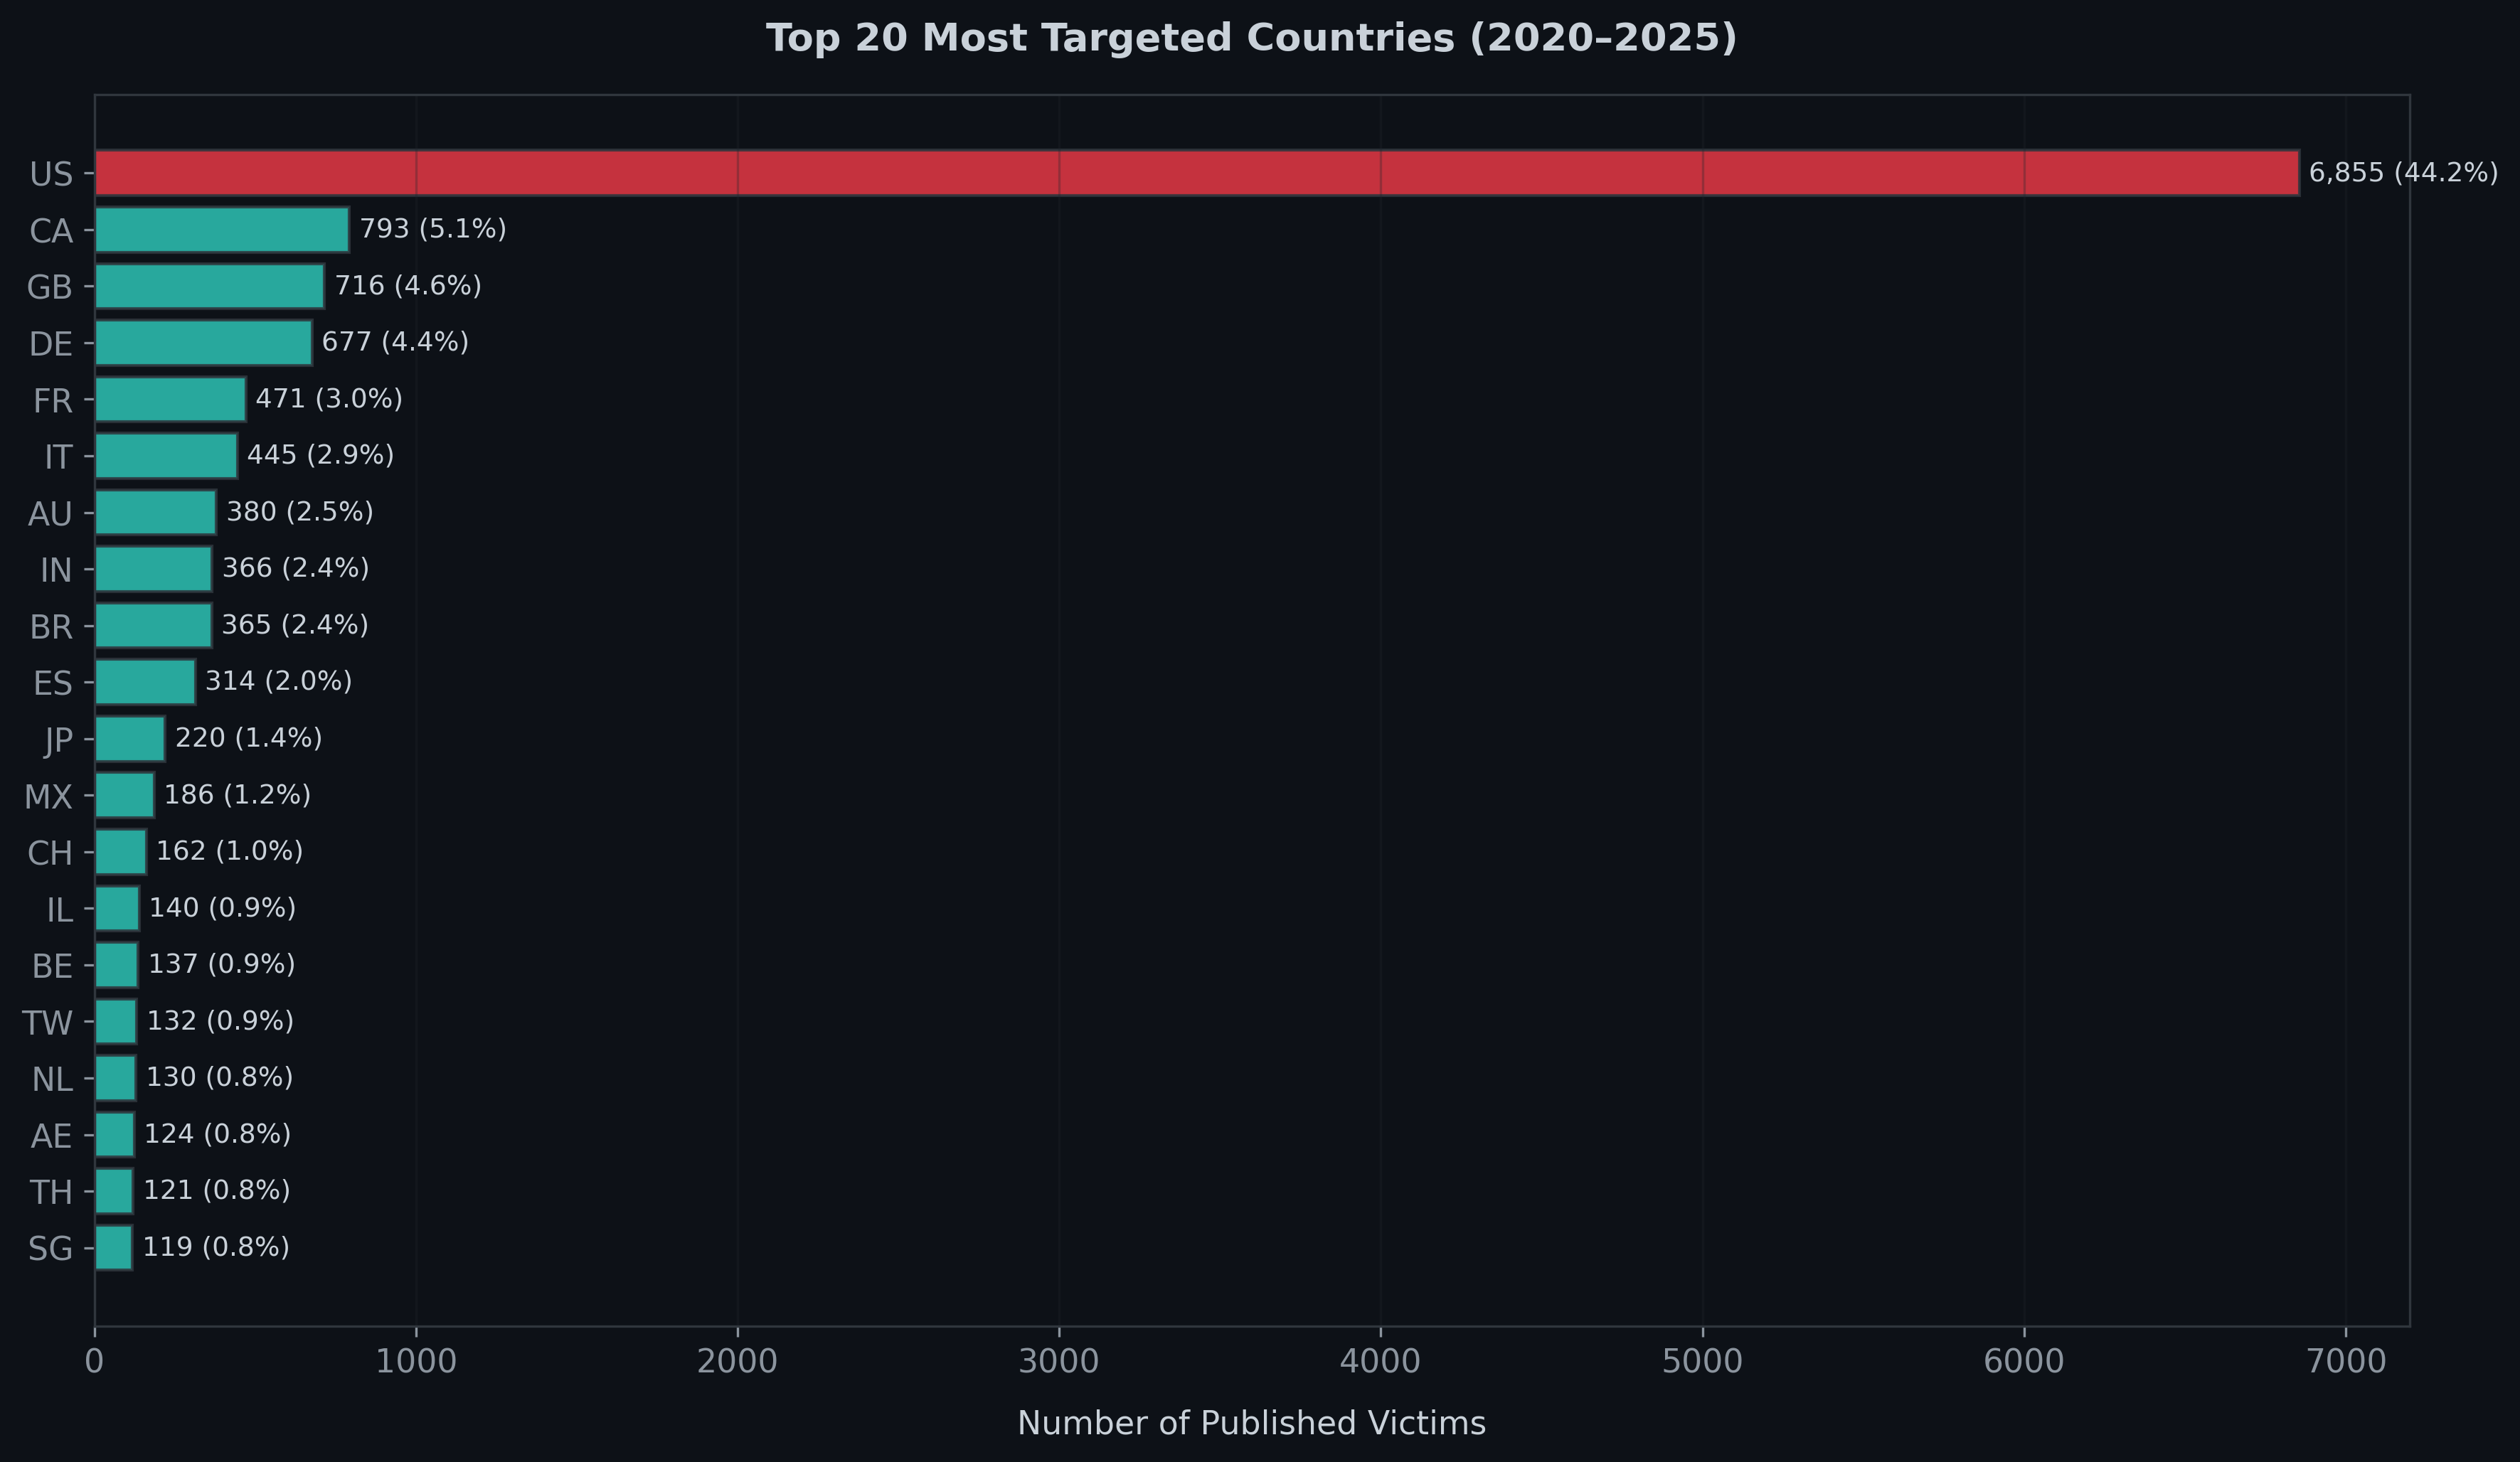
At the same time, ransomware is clearly a global phenomenon. Alongside North American and Western European nations, victims appear across Asia, Latin America, and the Middle East.
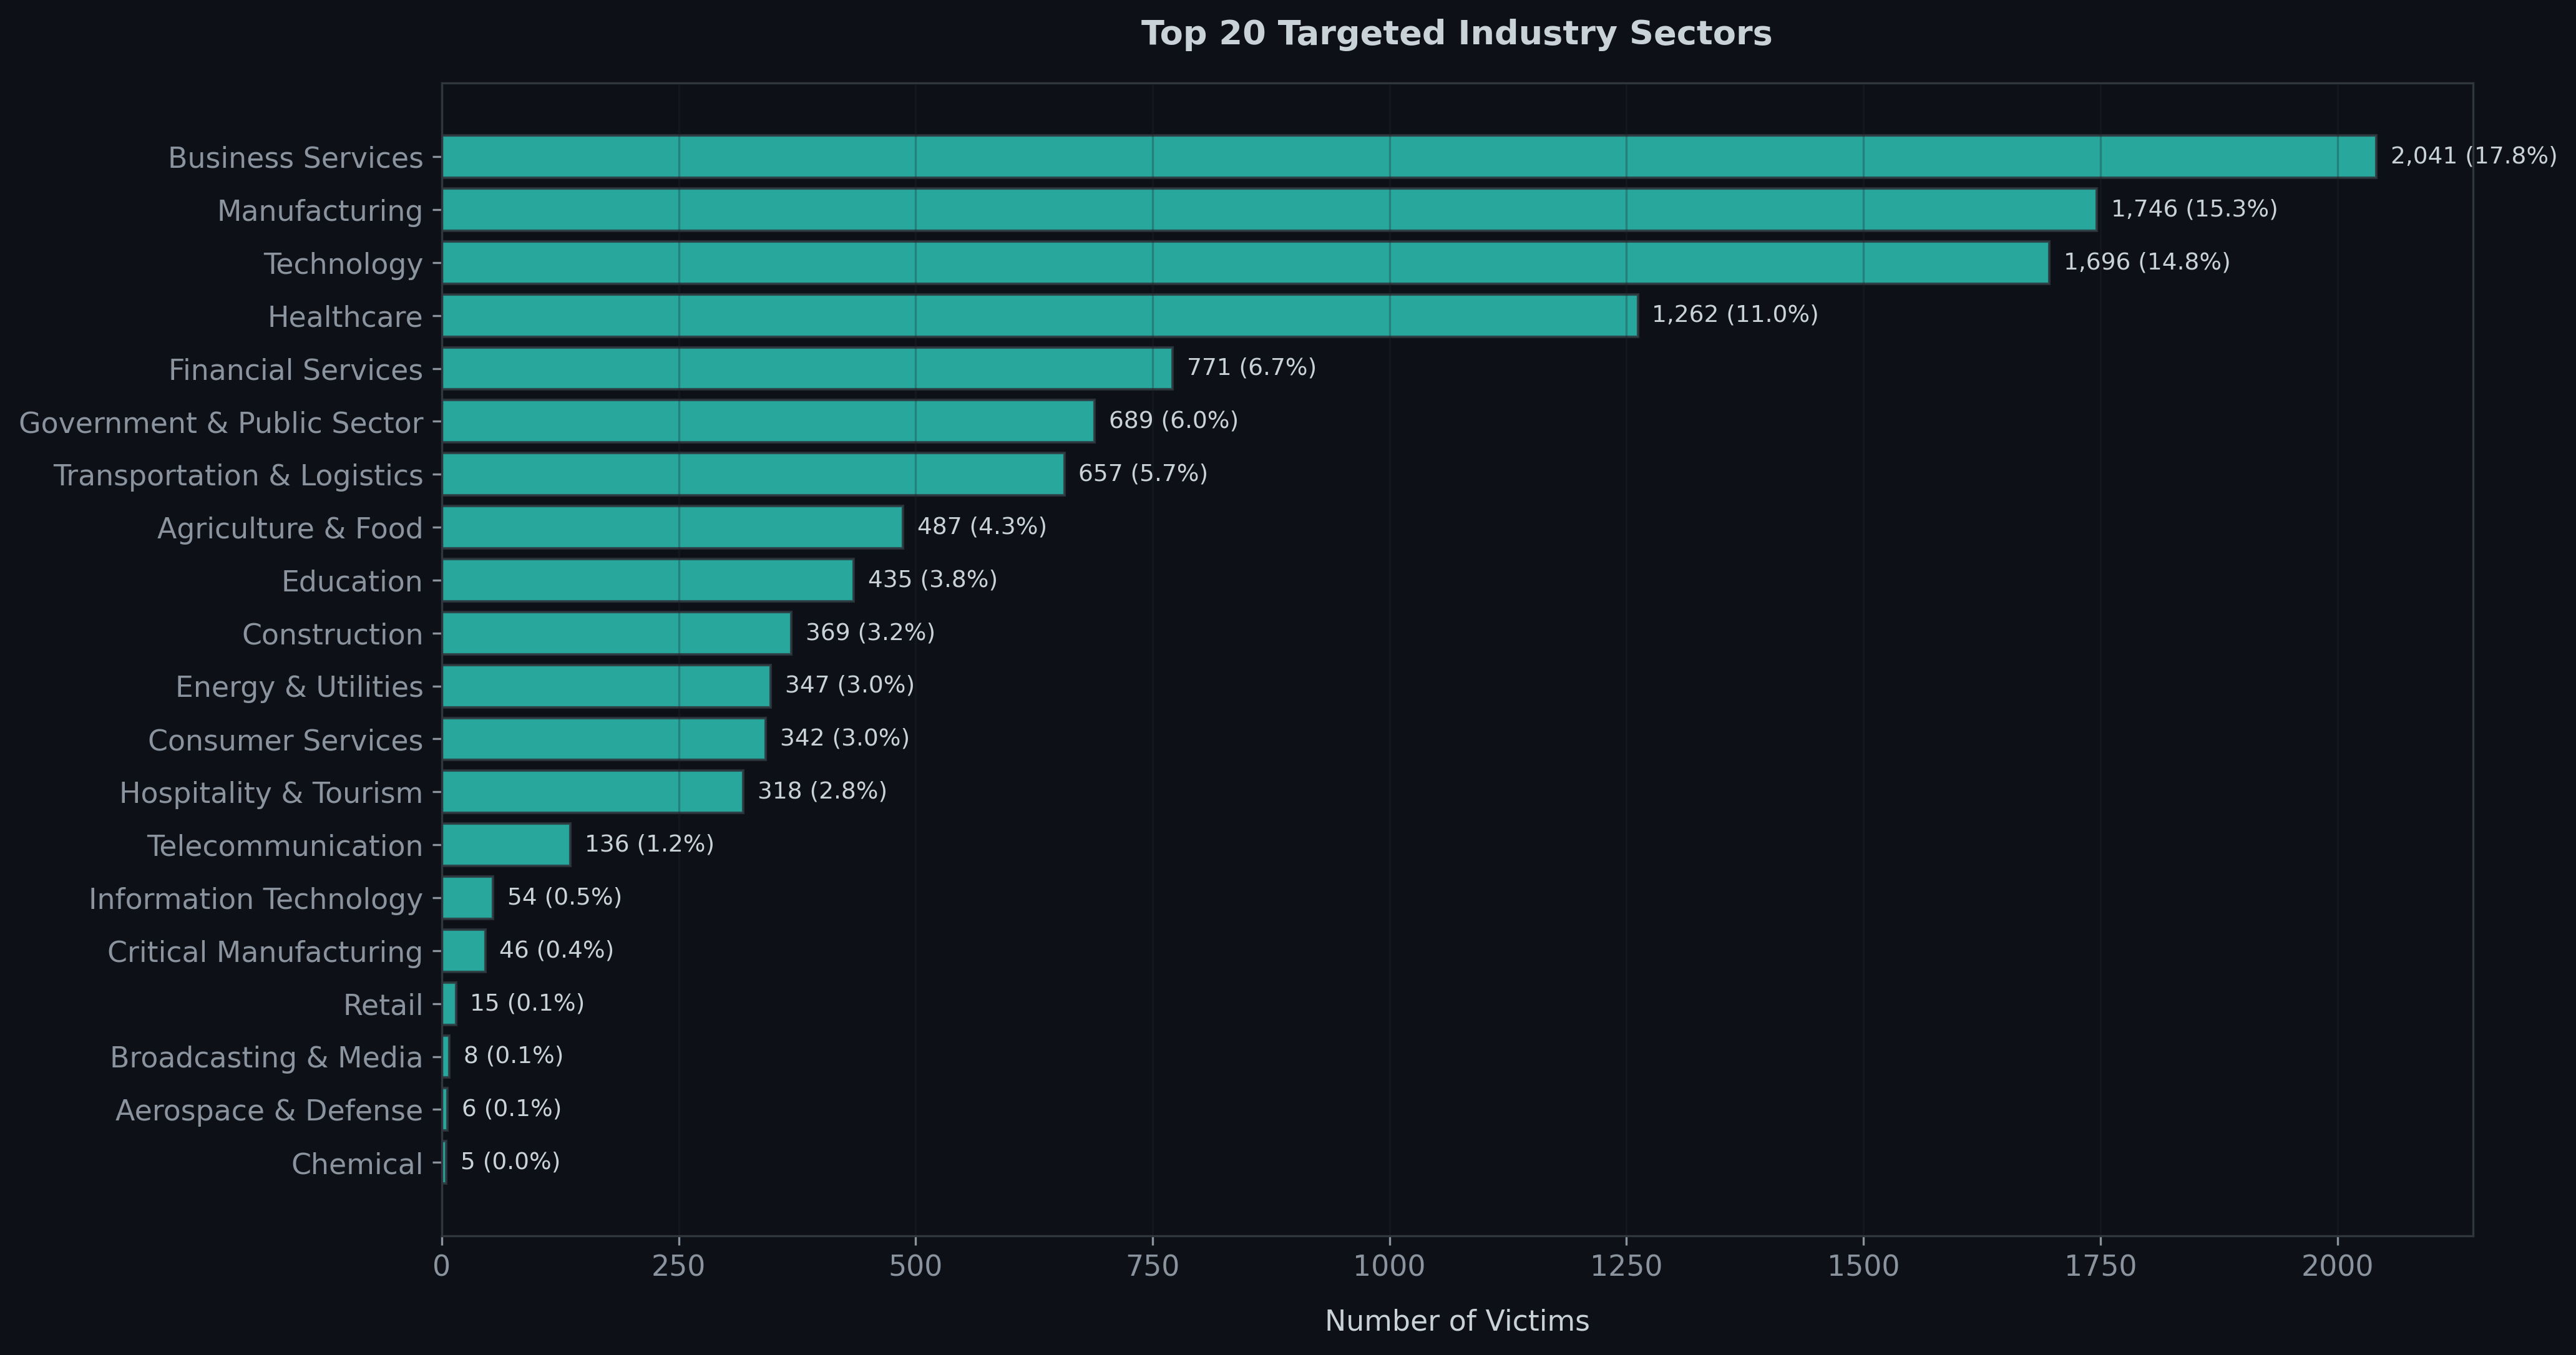
By industry, business services, manufacturing, and technology dominate victim claims, followed by healthcare. These are sectors with high dependency on system availability, sensitive data, or complex supply chains where downtime causes immediate financial loss.
Sector share shifts over time. Comparing 2024 with 2025 shows a decline in victims in business services alongside an increase in attacks on education and construction.
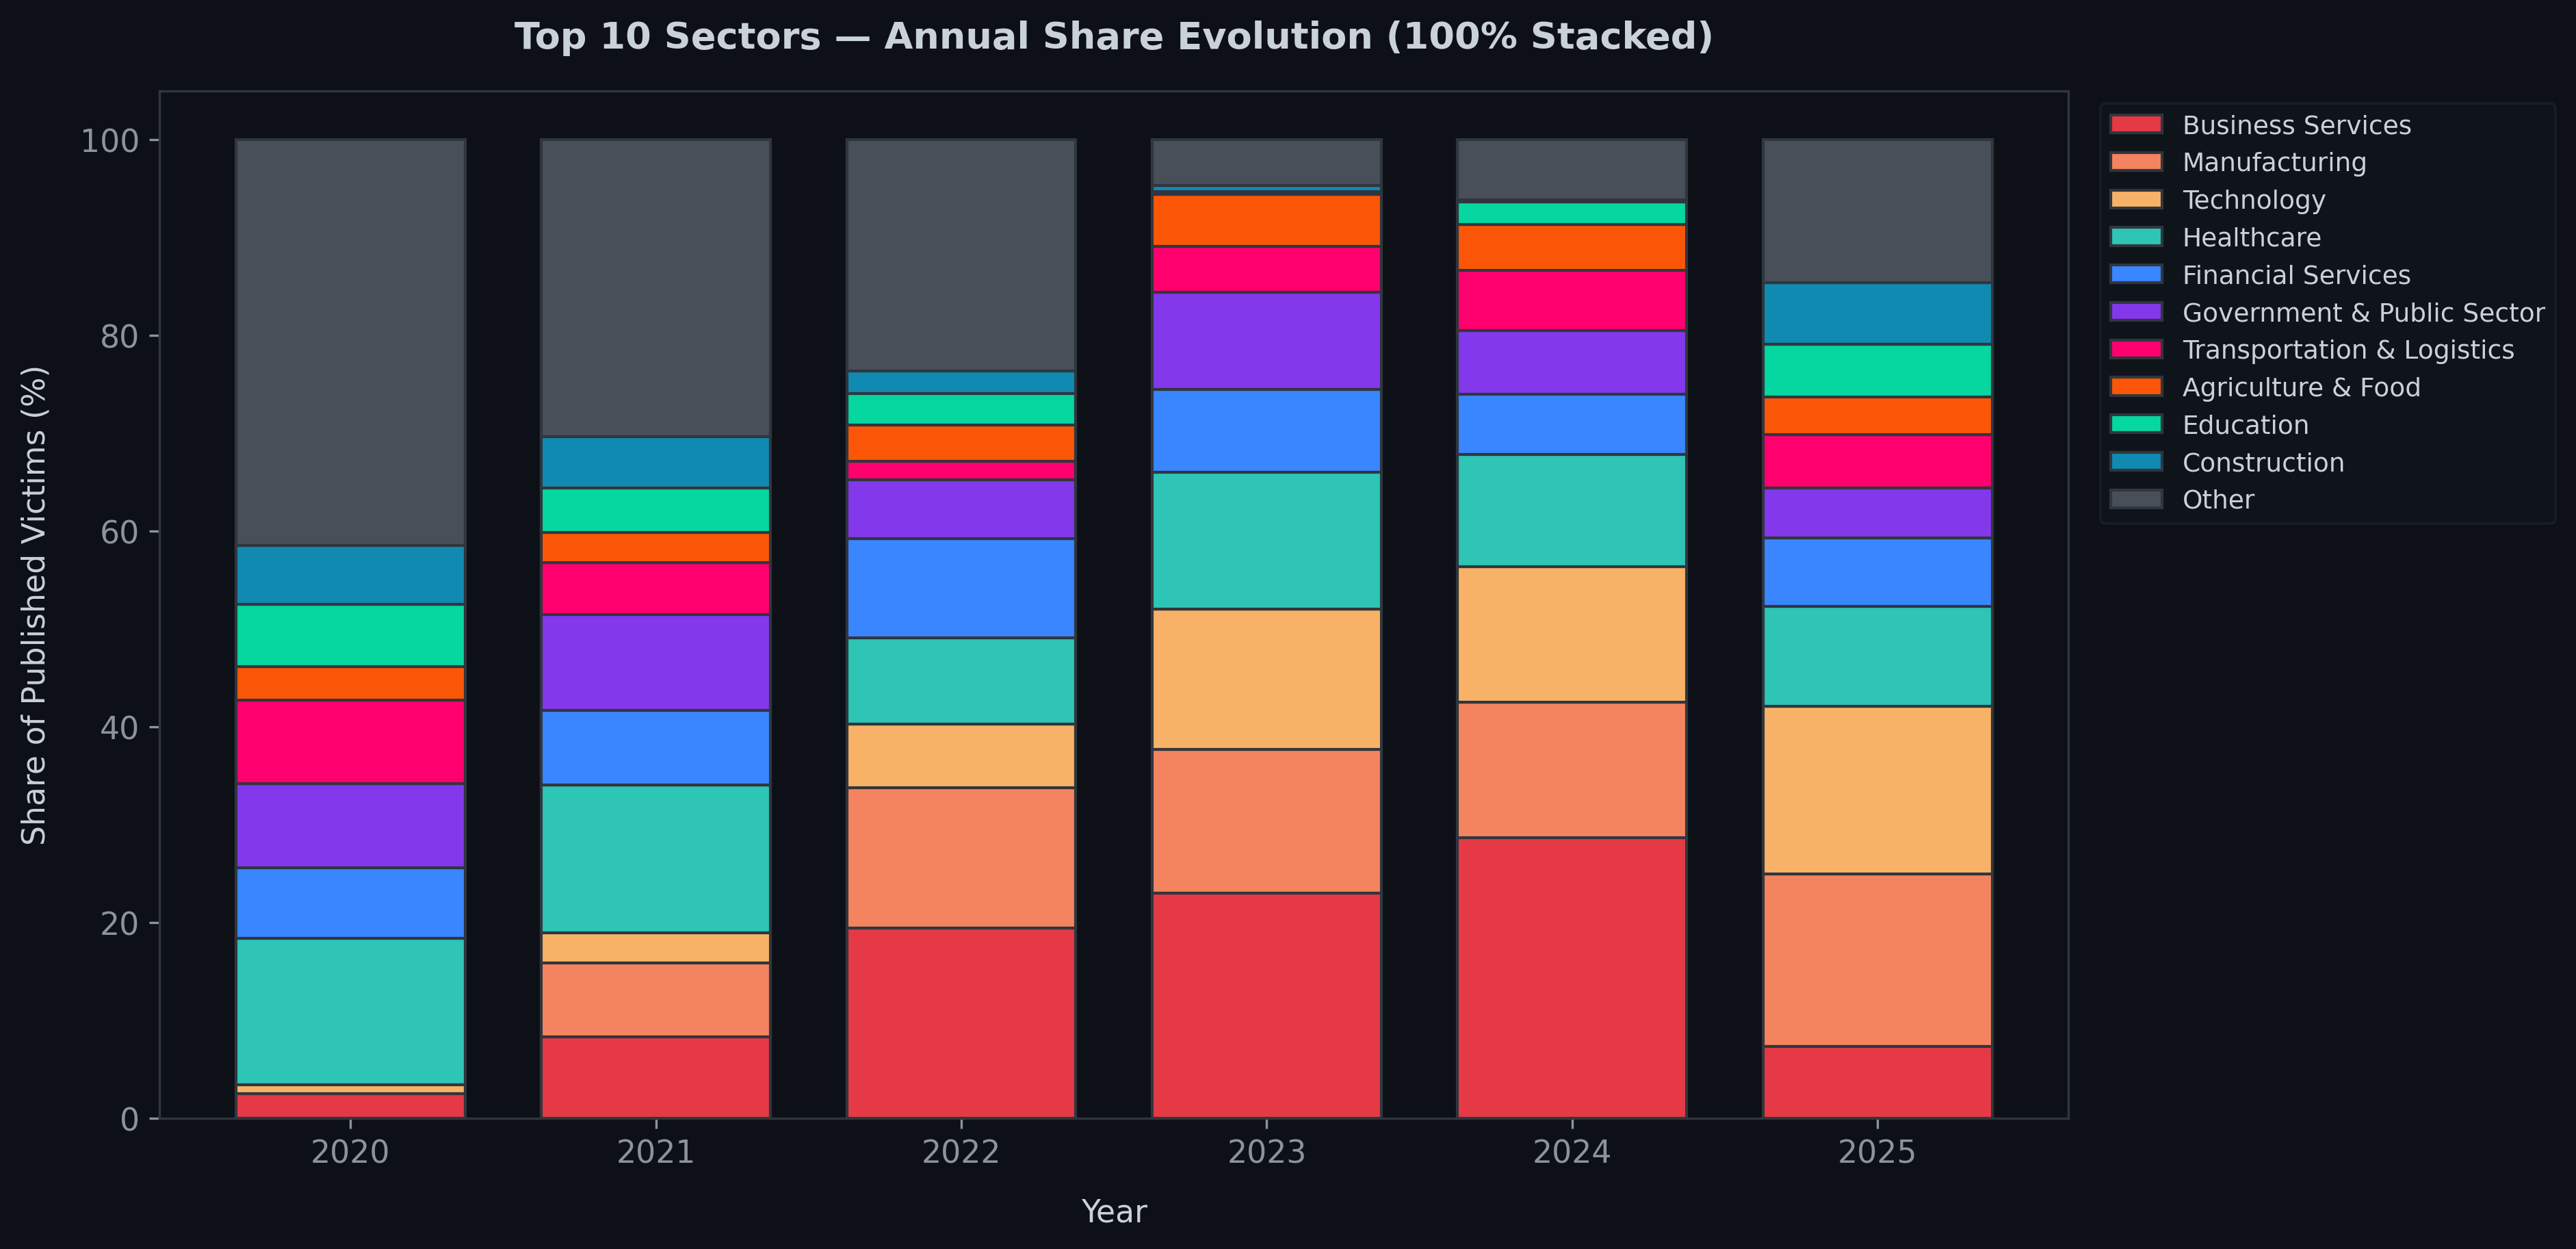
This change may stem from the fact that business and professional services were the main target in earlier years, leading to heavy investments in security, detection, and overall resilience. They have become costlier and more difficult targets for attackers, whose focus may be shifting toward sectors that have not faced the same historical pressure and have lower security maturity than financial services or enterprise IT.
Looking across sectors also shows that individual ransomware groups do not share identical target profiles, but exhibit clear specialization.
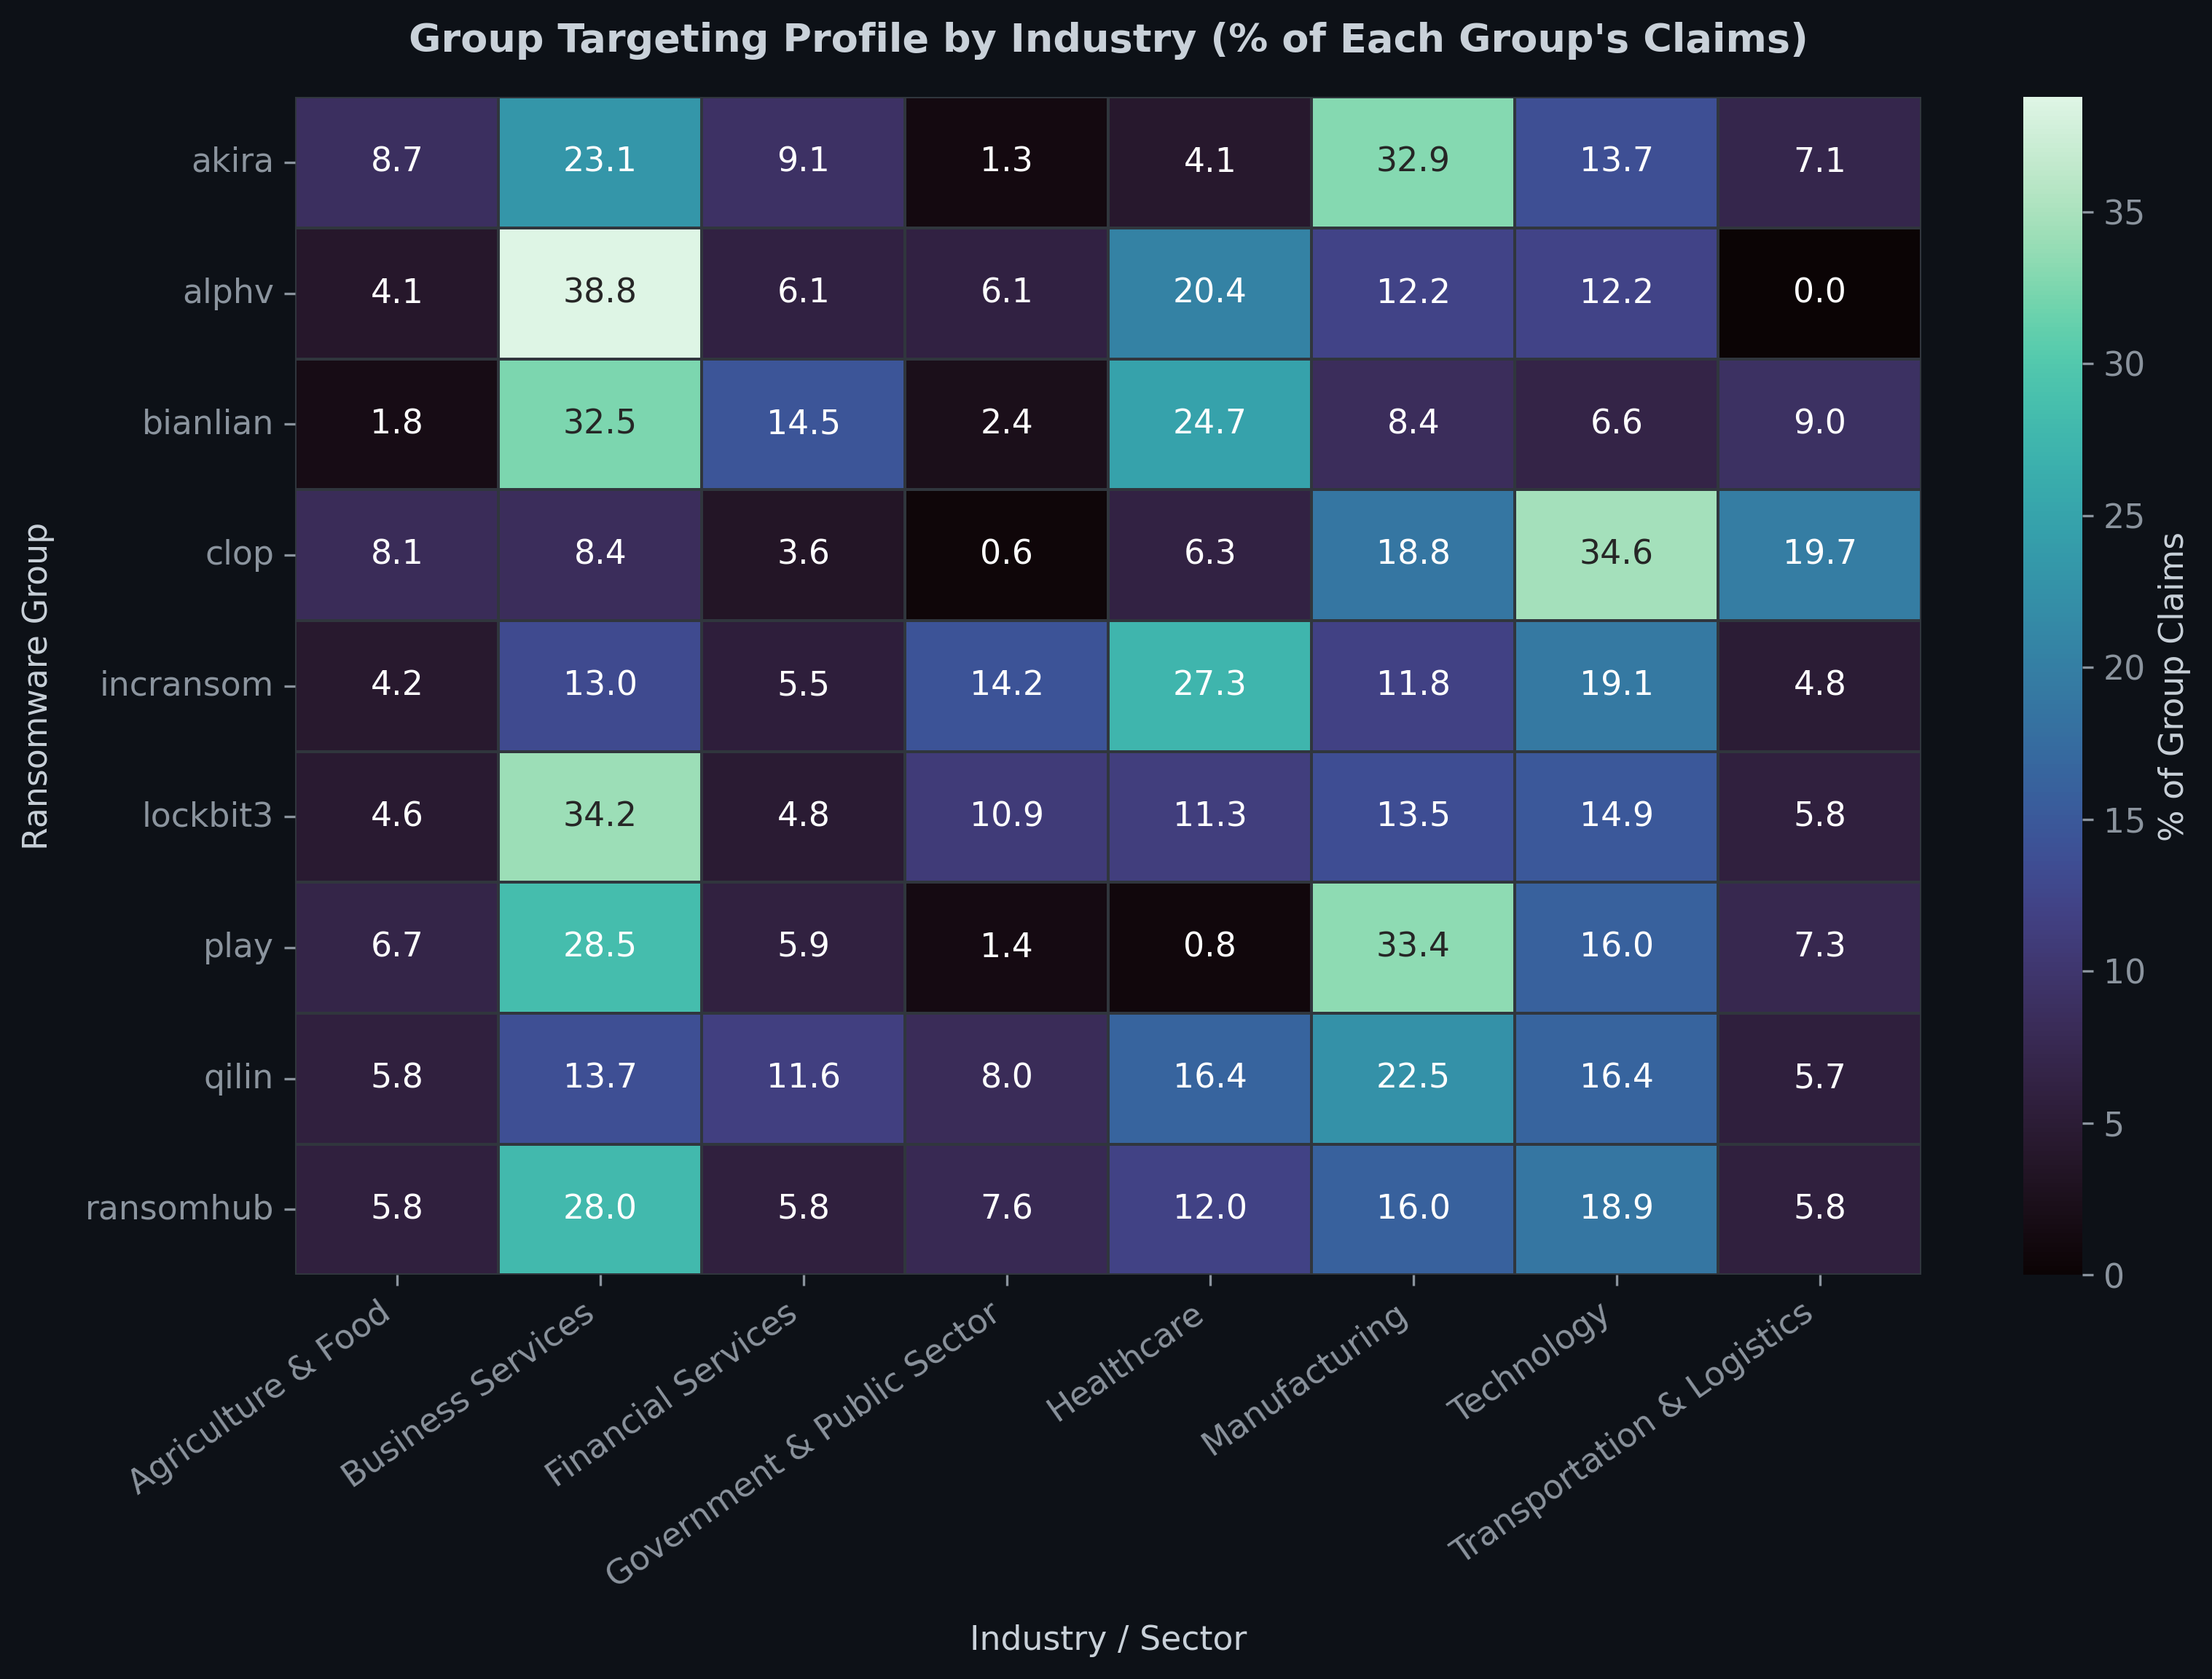
LockBit 3.0 and ALPHV have a significant share of victims in Business Services. Clop concentrates heavily on Technology and partly on Transportation and Logistics (often through mass software vulnerability campaigns like MOVEit and GoAnywhere). Play and Akira have higher representation in Manufacturing, while Inc Ransom shows a relatively strong orientation toward Healthcare.
The chart shows that while most groups hit multiple sectors at once, there are typically one or two segments where their activity is above average. This may relate to preferred initial access vectors, affiliate specializations, or targeted victim selection based on company size and ability to pay. The spread of attacks is not accidental: ransomware operations show clear signs of strategic focus, with groups profiling in specific industries without limiting themselves to them exclusively.
7. To Pay or Not to Pay: What Negotiation Data Reveals
Beyond the aggregate statistics mentioned above, data on ransom negotiations is also available online: message counts, initial demands, negotiated amounts, and confirmation of whether payment was made.
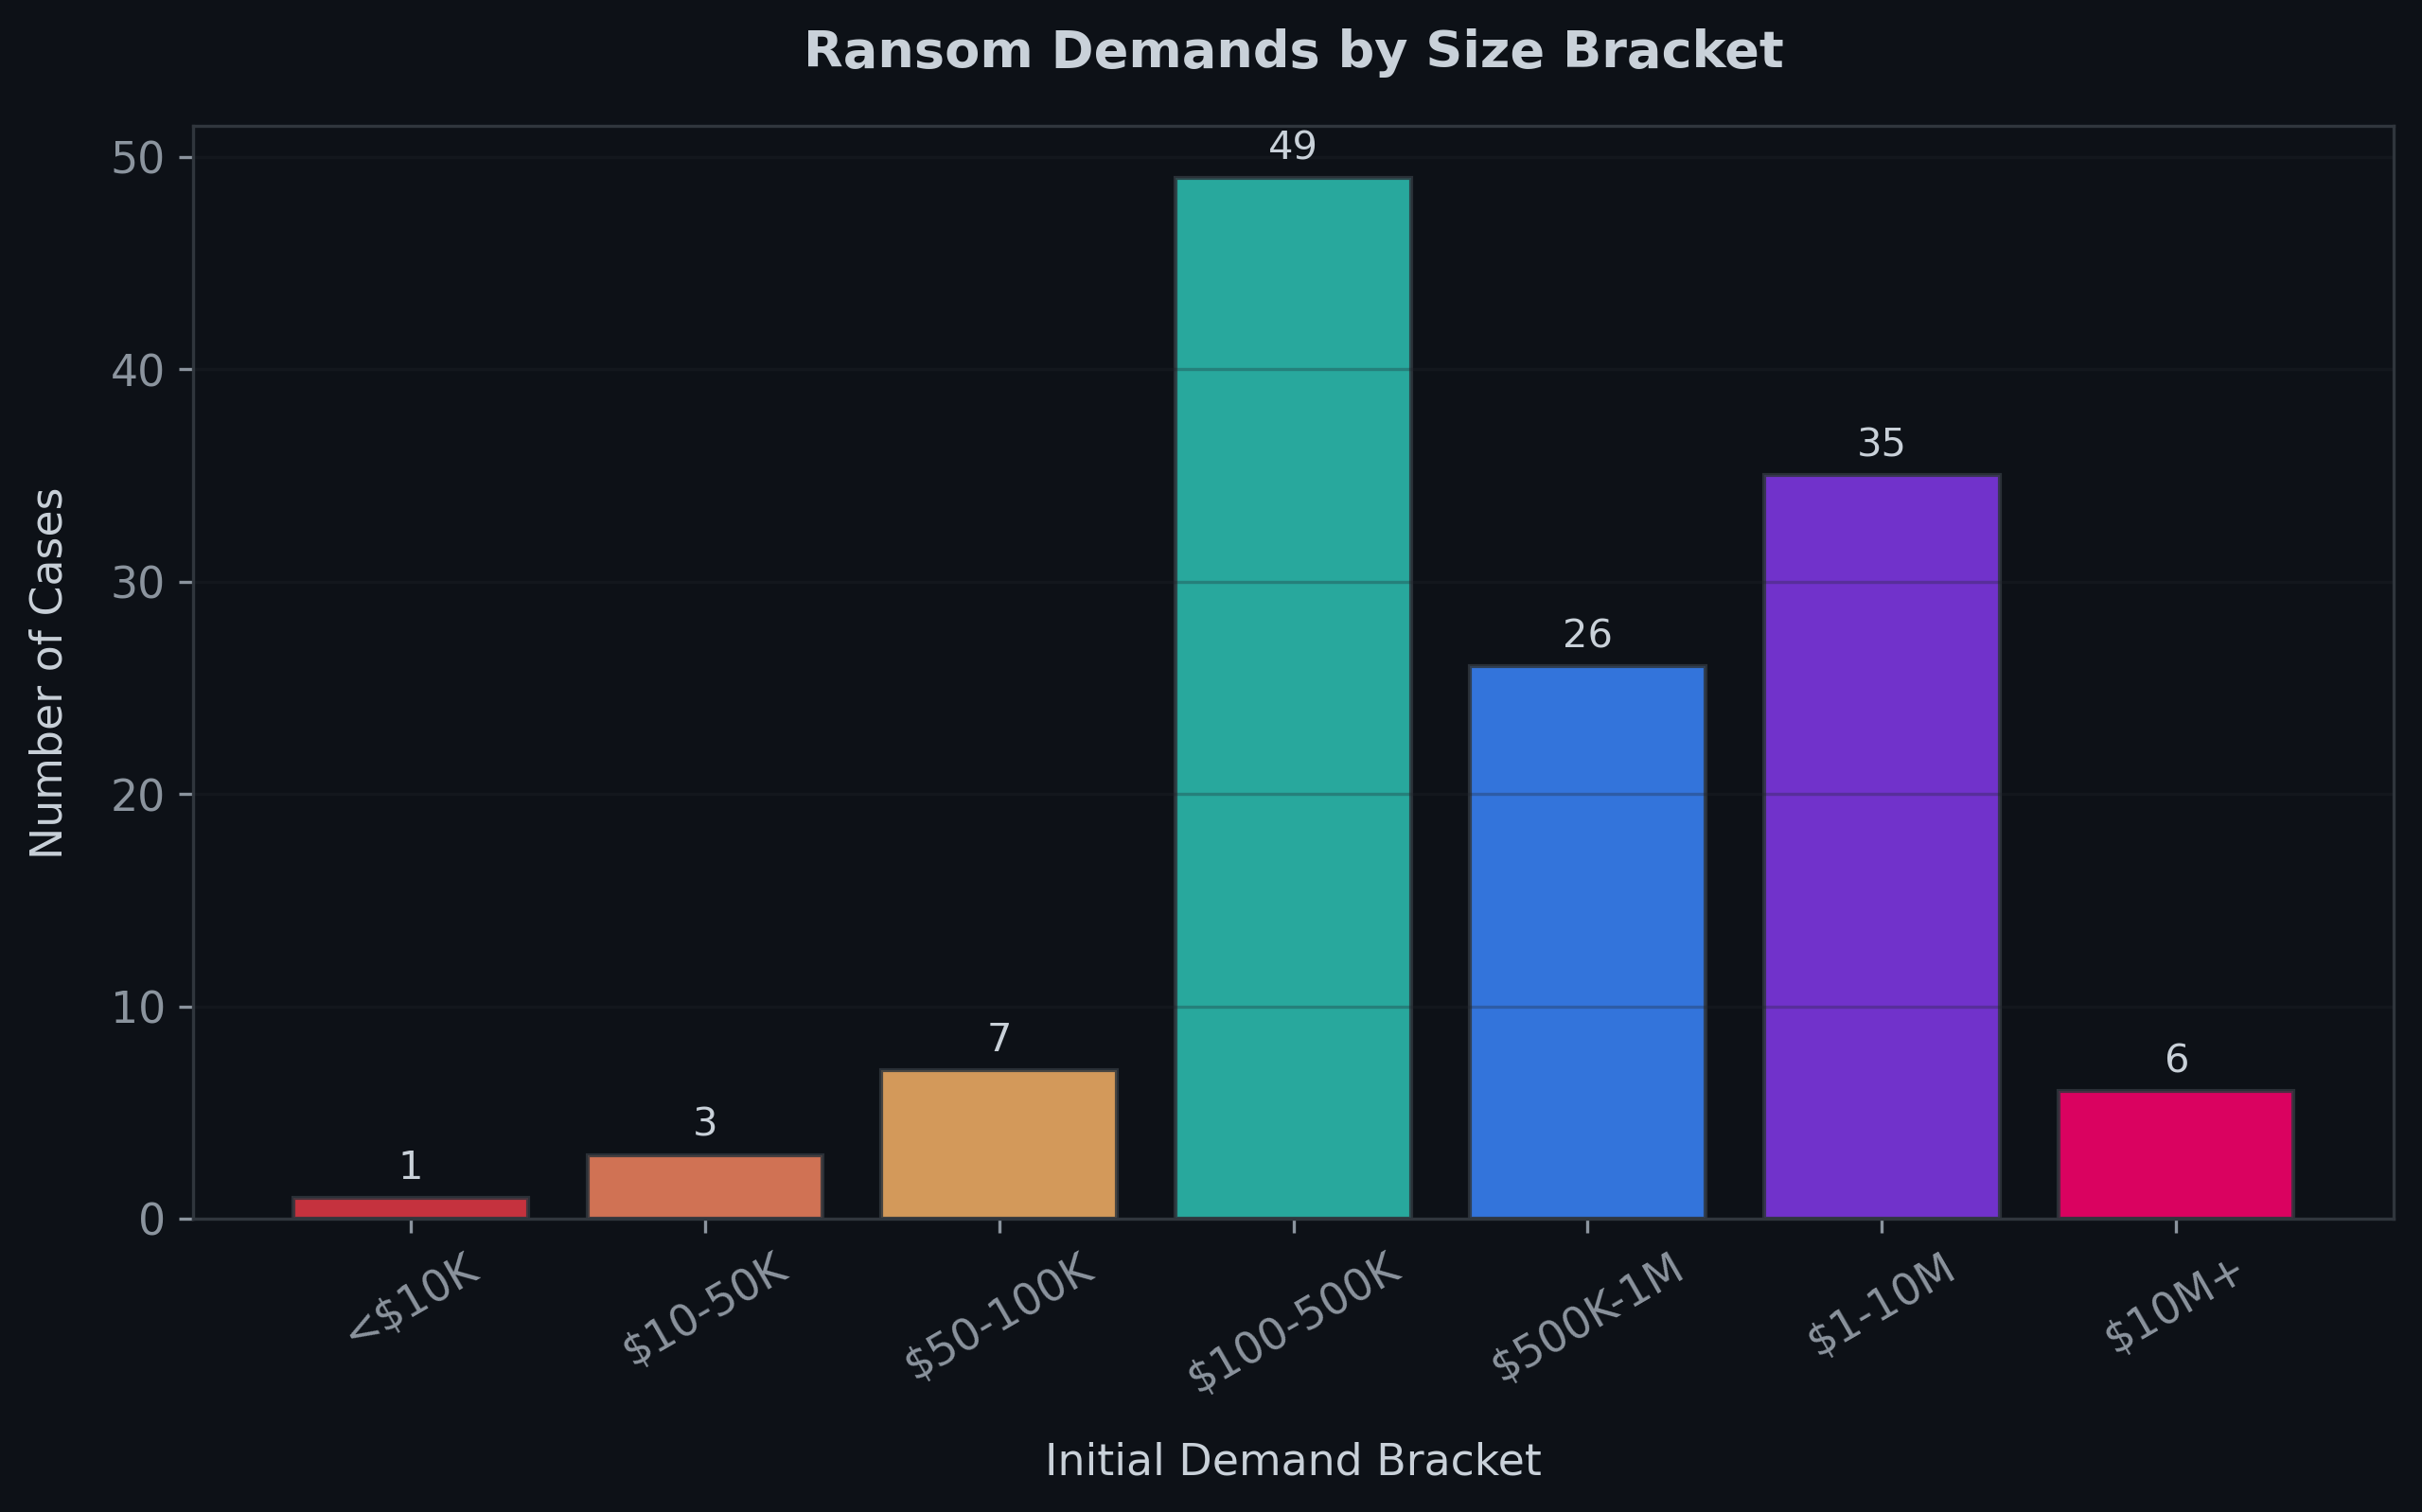
The dataset includes 168 published negotiation samples from 22 groups. Information on initial demands was present in 126 samples, while both initial demand and final negotiated price were captured in 88 cases.
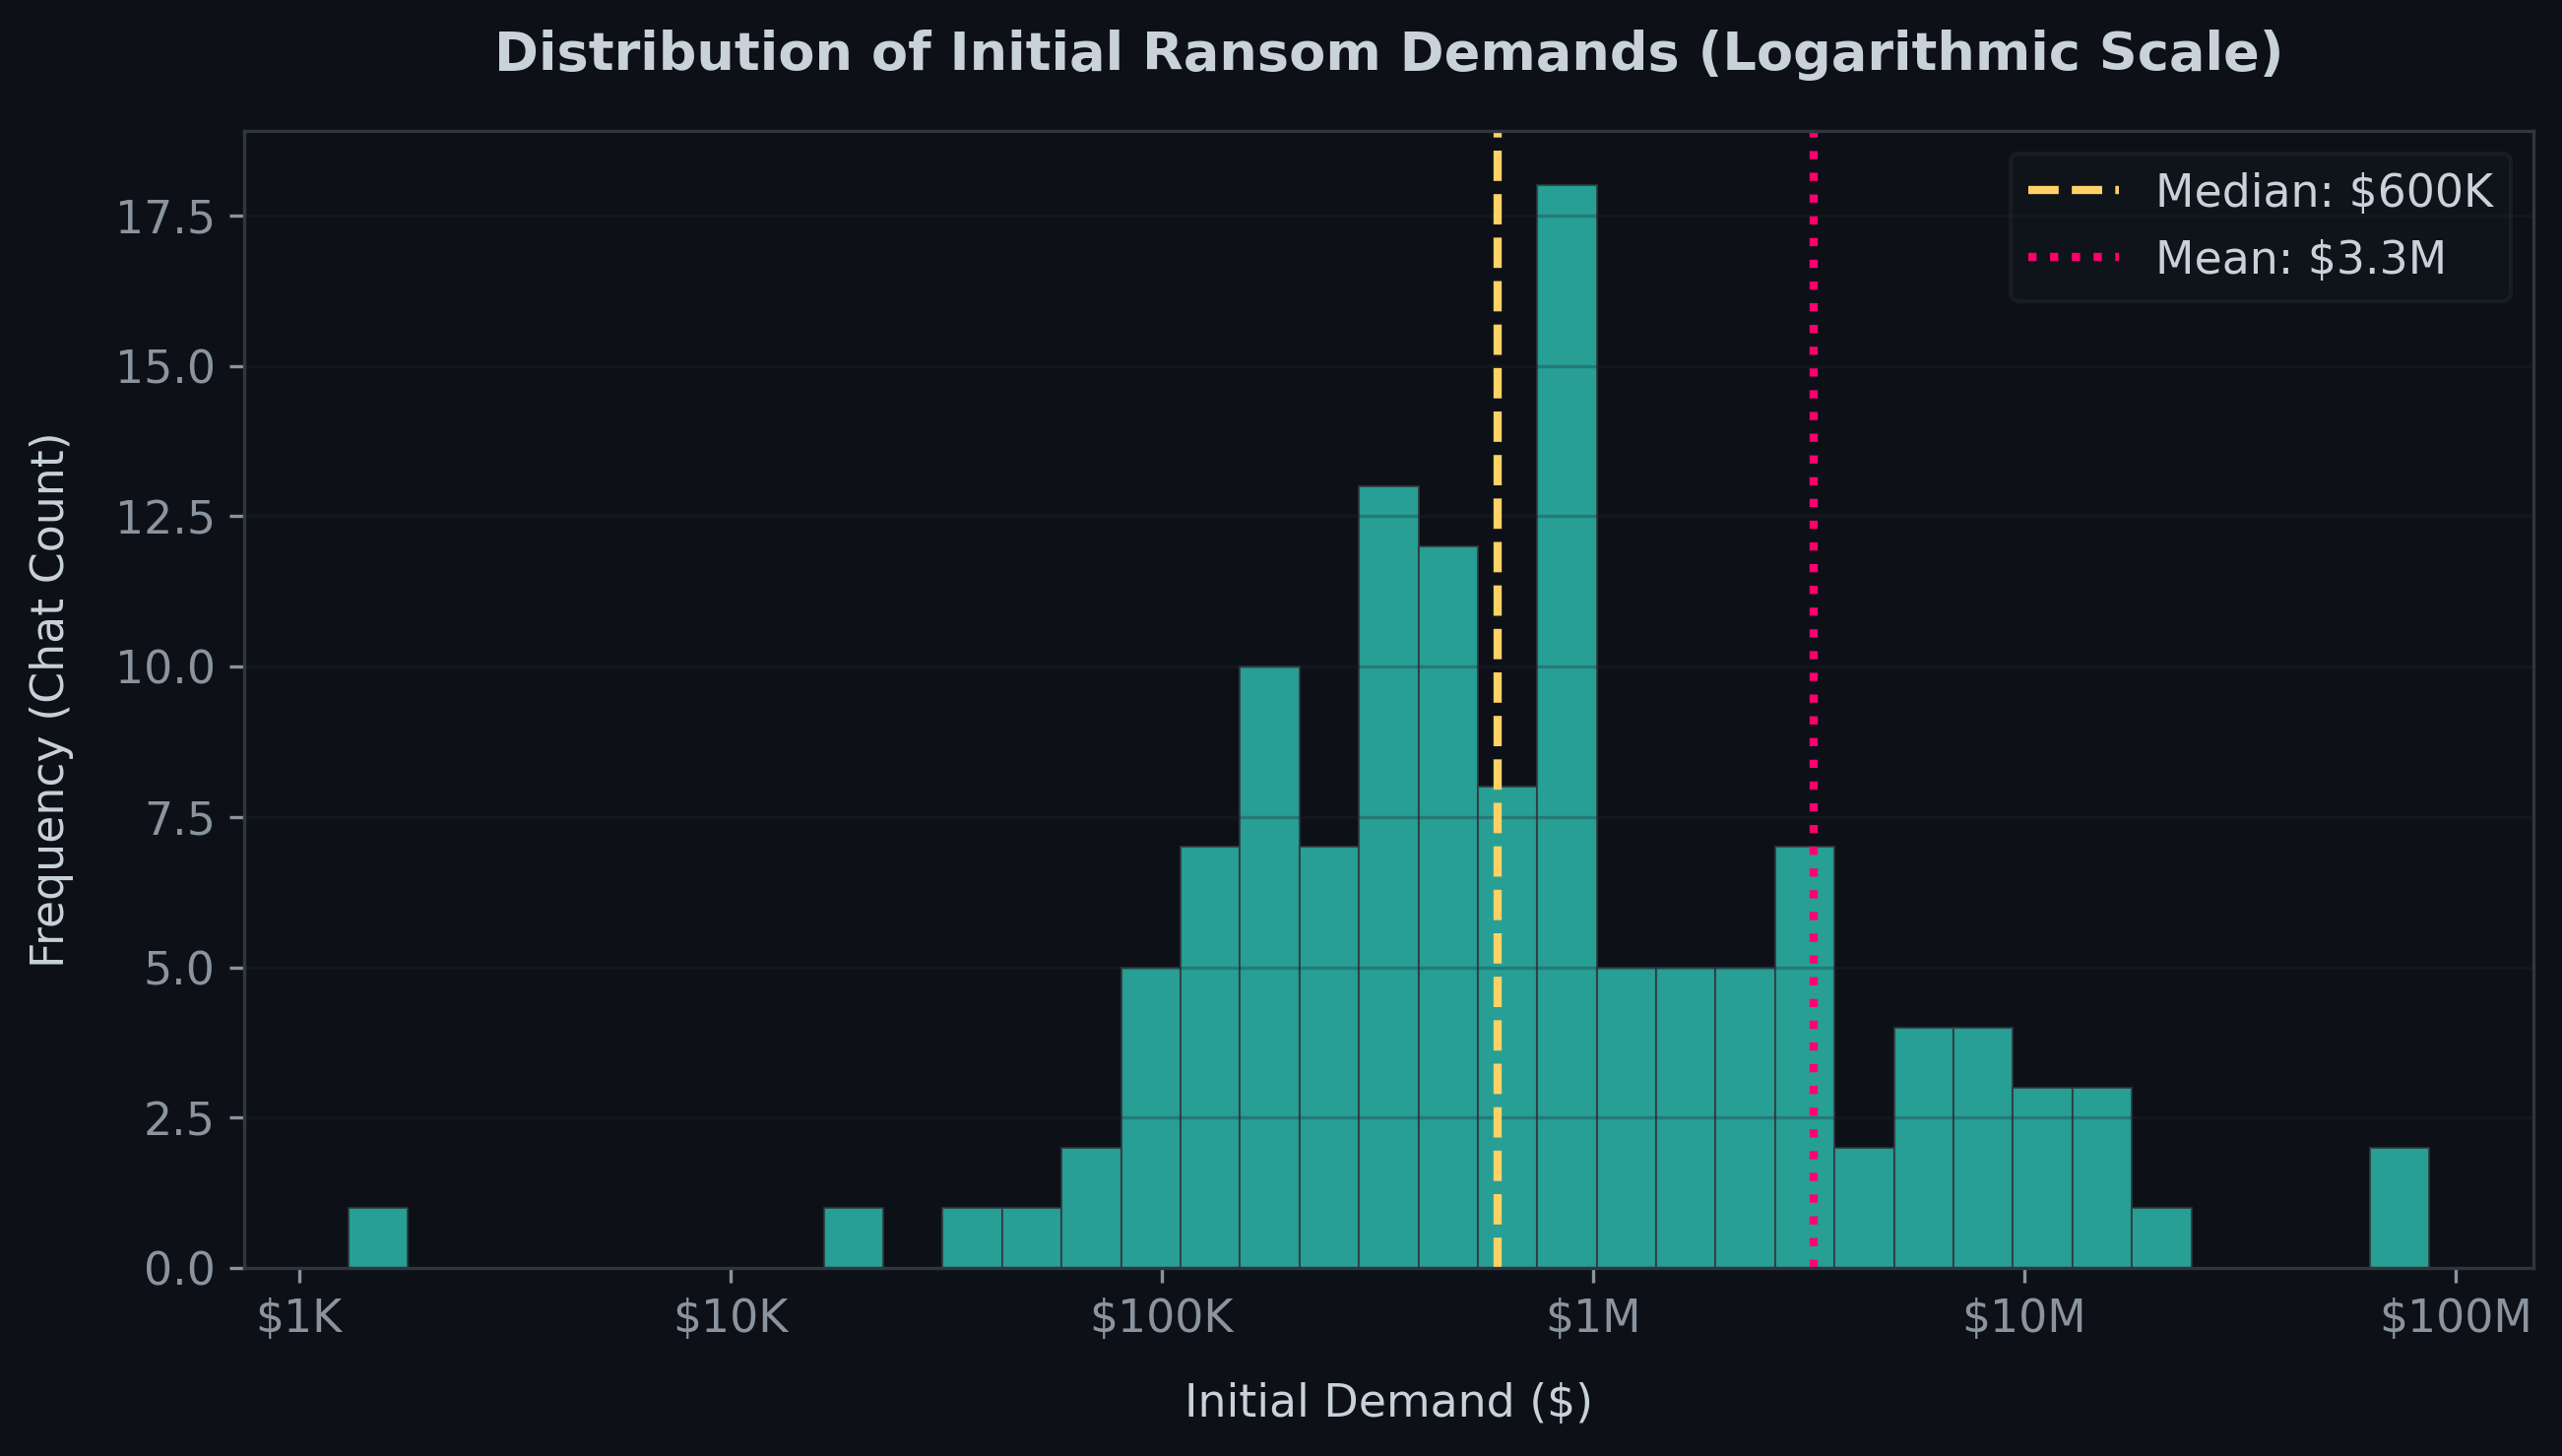
The median initial demand was $600,000, while the median actual payment was $150,000. The difference between the opening price tag and the amount actually paid is substantial. In cases where negotiation took place, the median discount reached 52%, and 98% of victims secured a discount. Negotiation is not an exception, but a standard part of the ransomware model.
Looking at median negotiated discounts shows that the most flexible groups include REvil (approx. 77%), Conti (~64%), and DarkSide (~62%). On the other hand, some groups are much less willing to concede: Hive showed a median discount of only around 29%.
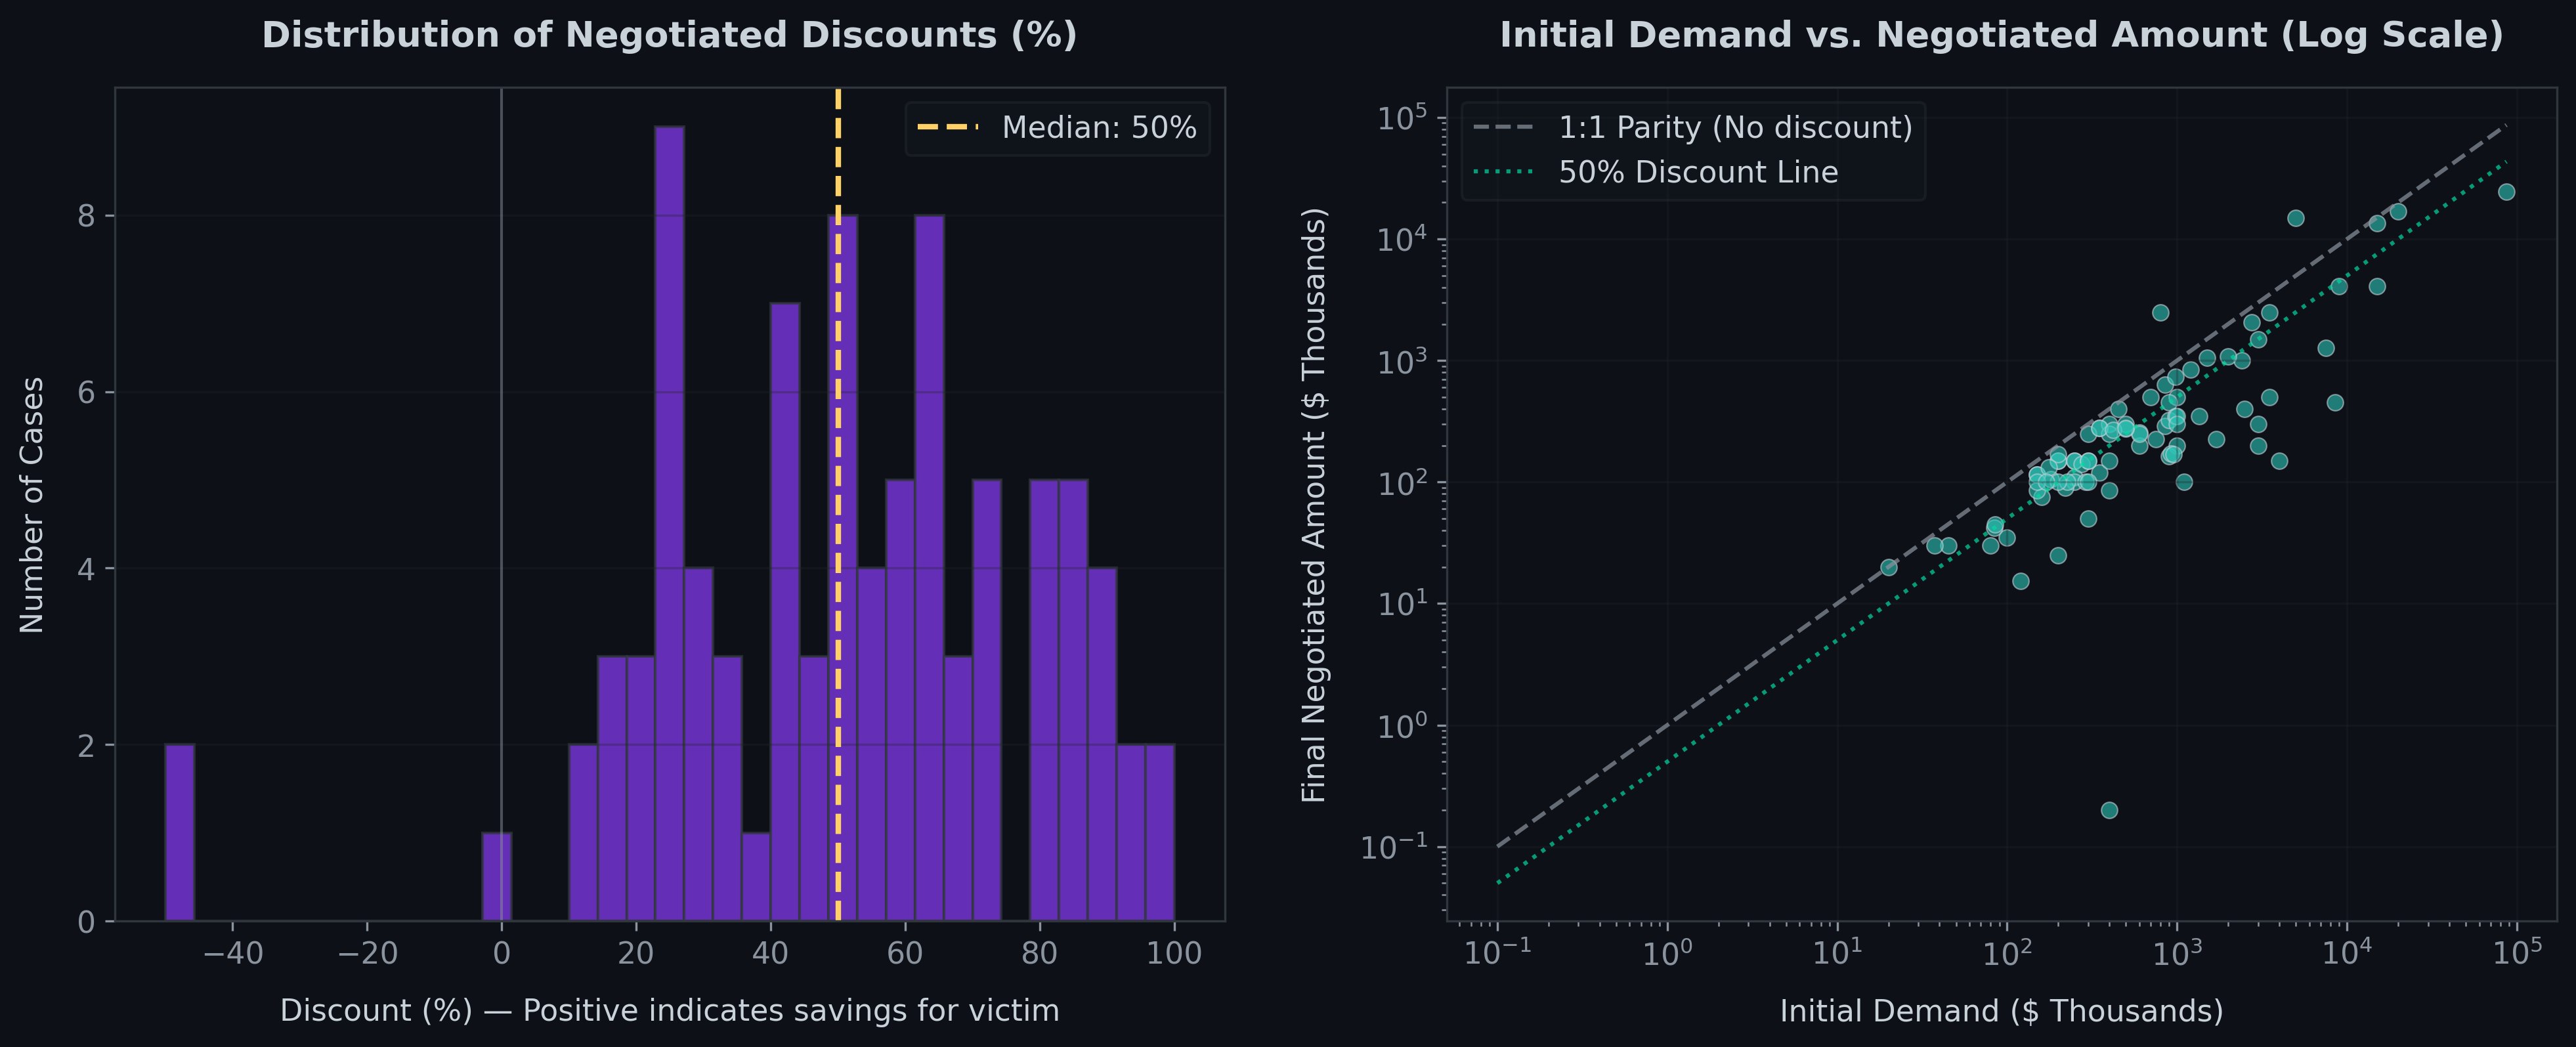
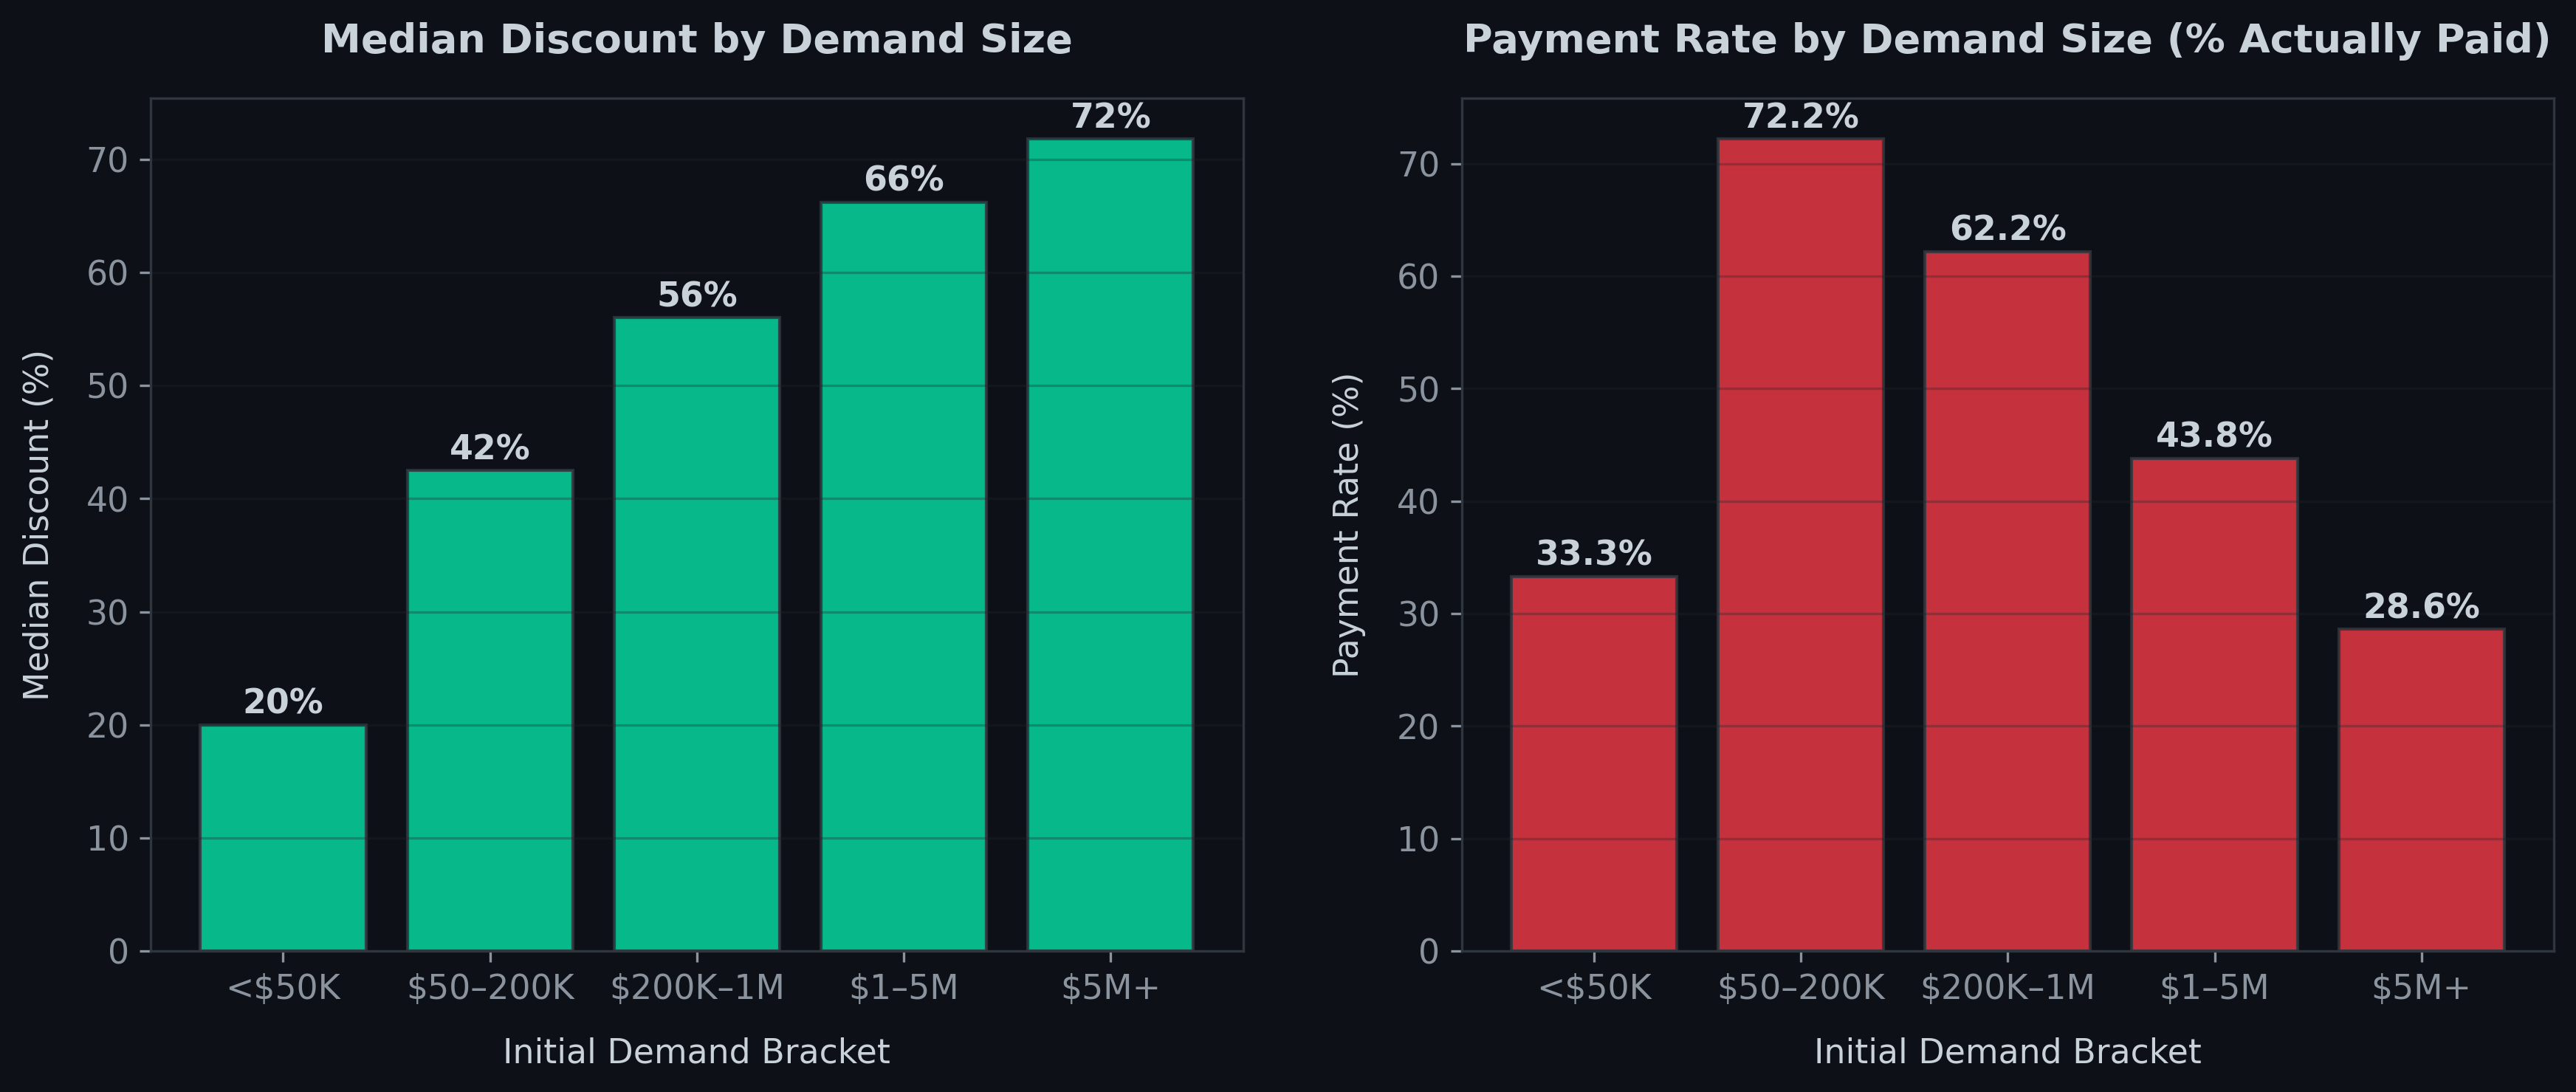
Interestingly, out of the top 10 largest initial ransom demands (up to $86.8 million), not a single one was paid in full. Extreme amounts function as psychological anchors rather than realistic expectations, and actual deals close much lower. The data shows that the higher the initial demand, the larger the percentage discount achieved in talks. At the same time, victims are more willing to settle smaller amounts, while extreme demands lead to much lower payment rates.
8. The Czech Republic in the Ransomware Data
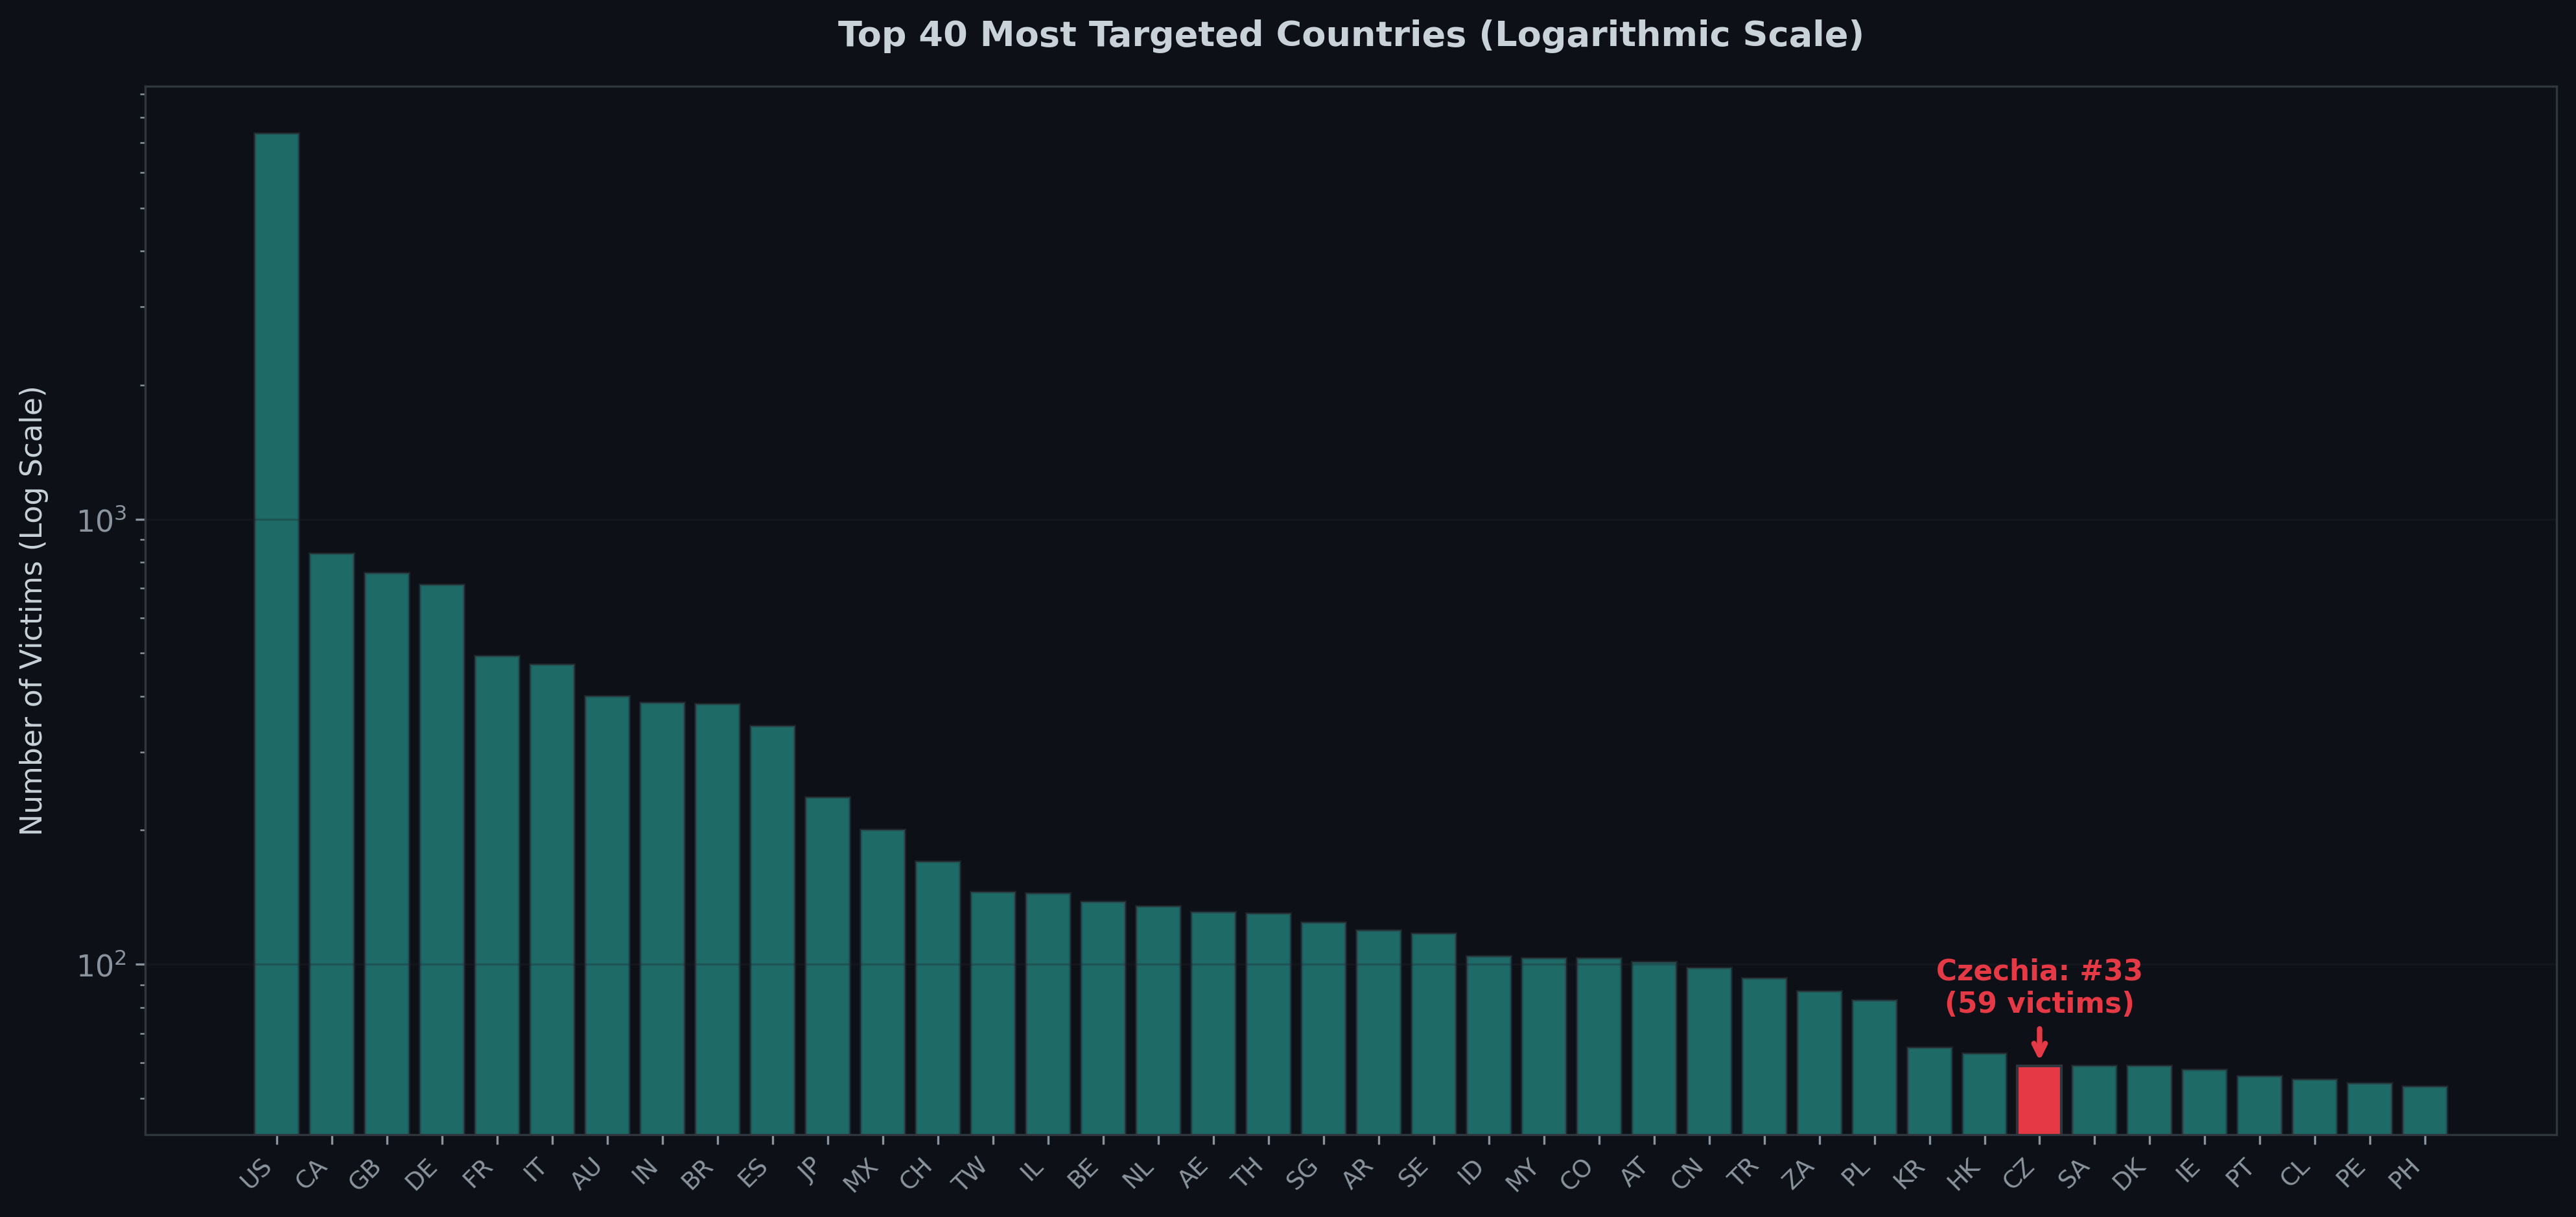
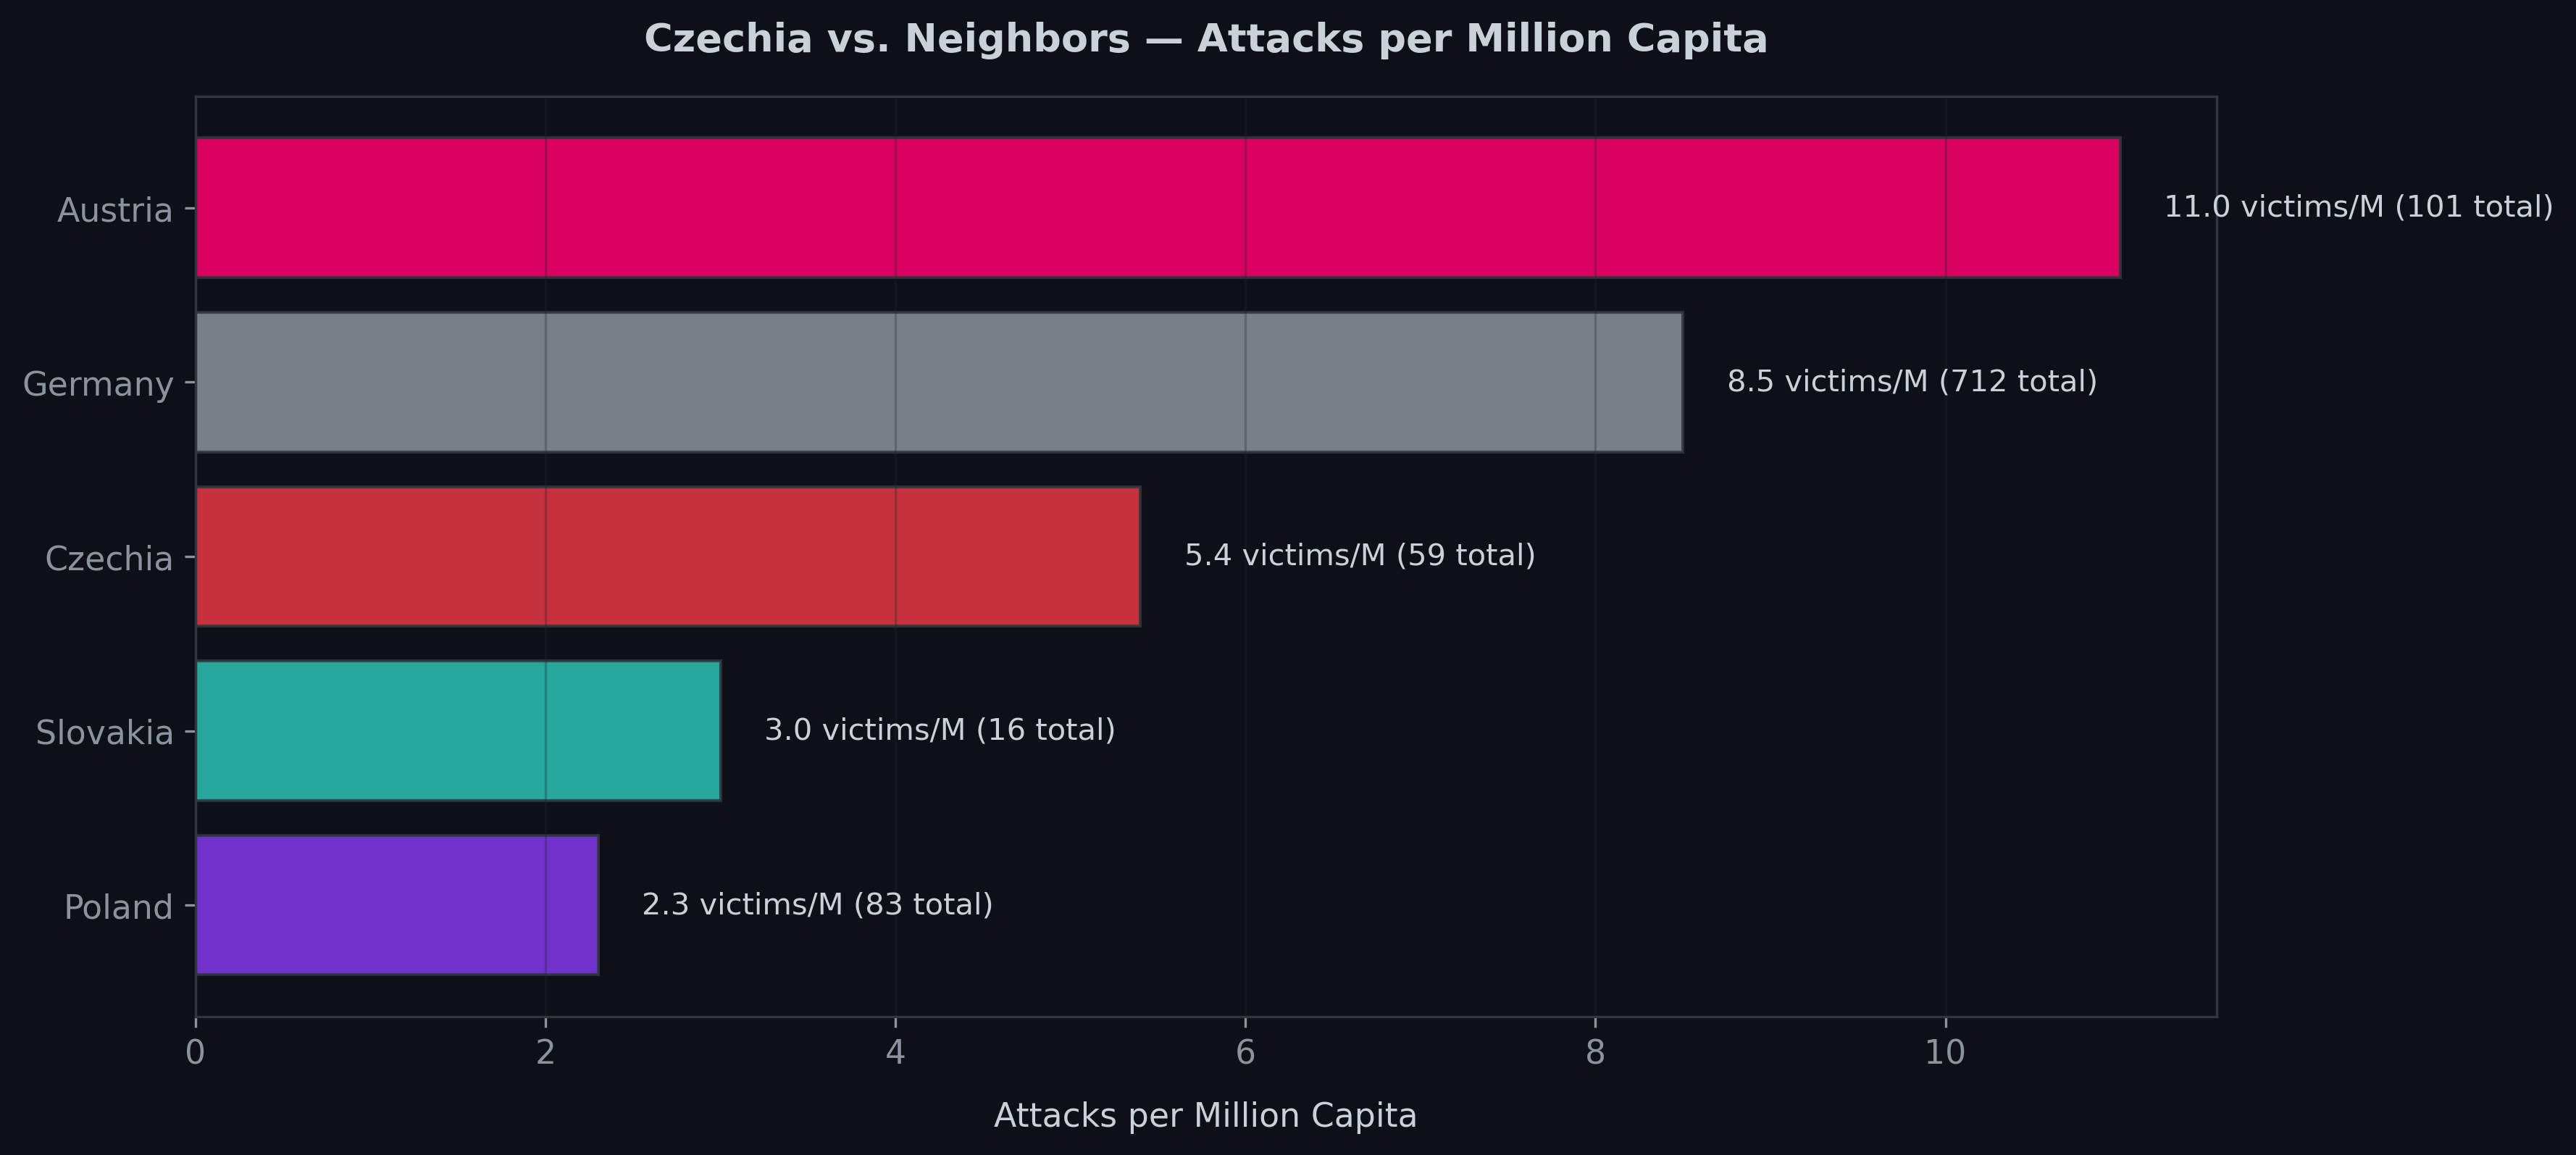
The data shows that Czechia is not a global epicenter of ransomware, but neither is it off the map. Of 25,680 incidents worldwide, Czechia accounts for 59 attacks (0.23%), ranking 33rd globally in absolute volume and 30th per capita (filtering for countries with at least 5 records to prevent small-sample distortion). That translates to 5.4 attacks per million residents, compared to 21.6 in the United States and 8.5 in Germany.
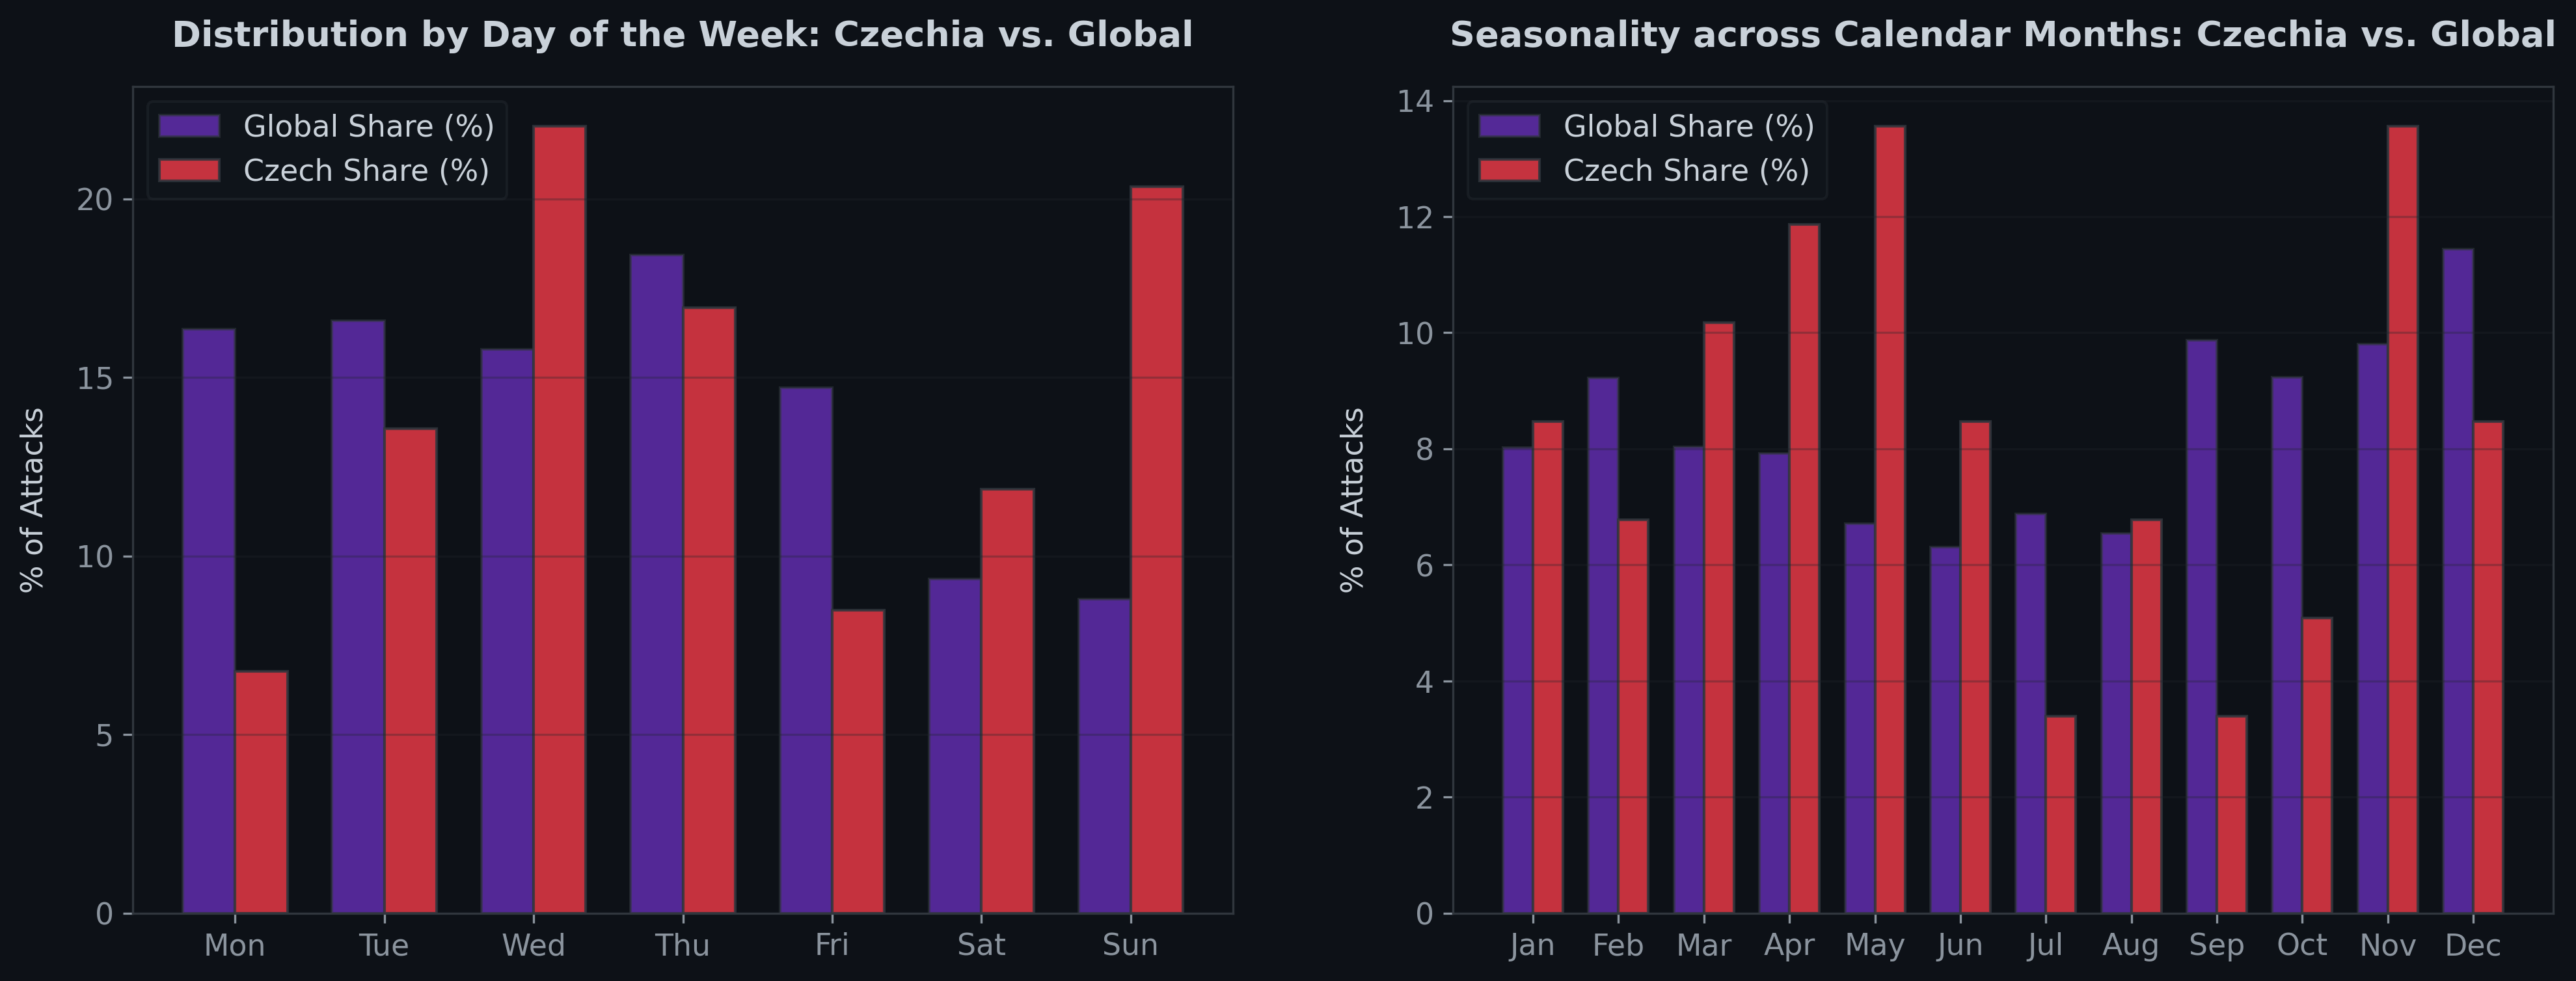
More interesting than the ranking itself is the operational dynamic. The correlation between Czech incident counts and global trends is low. The Czech curve does not follow world totals; it has its own cycles and surges. The same applies to the distribution of attacks across days of the week and seasonality across the calendar year.
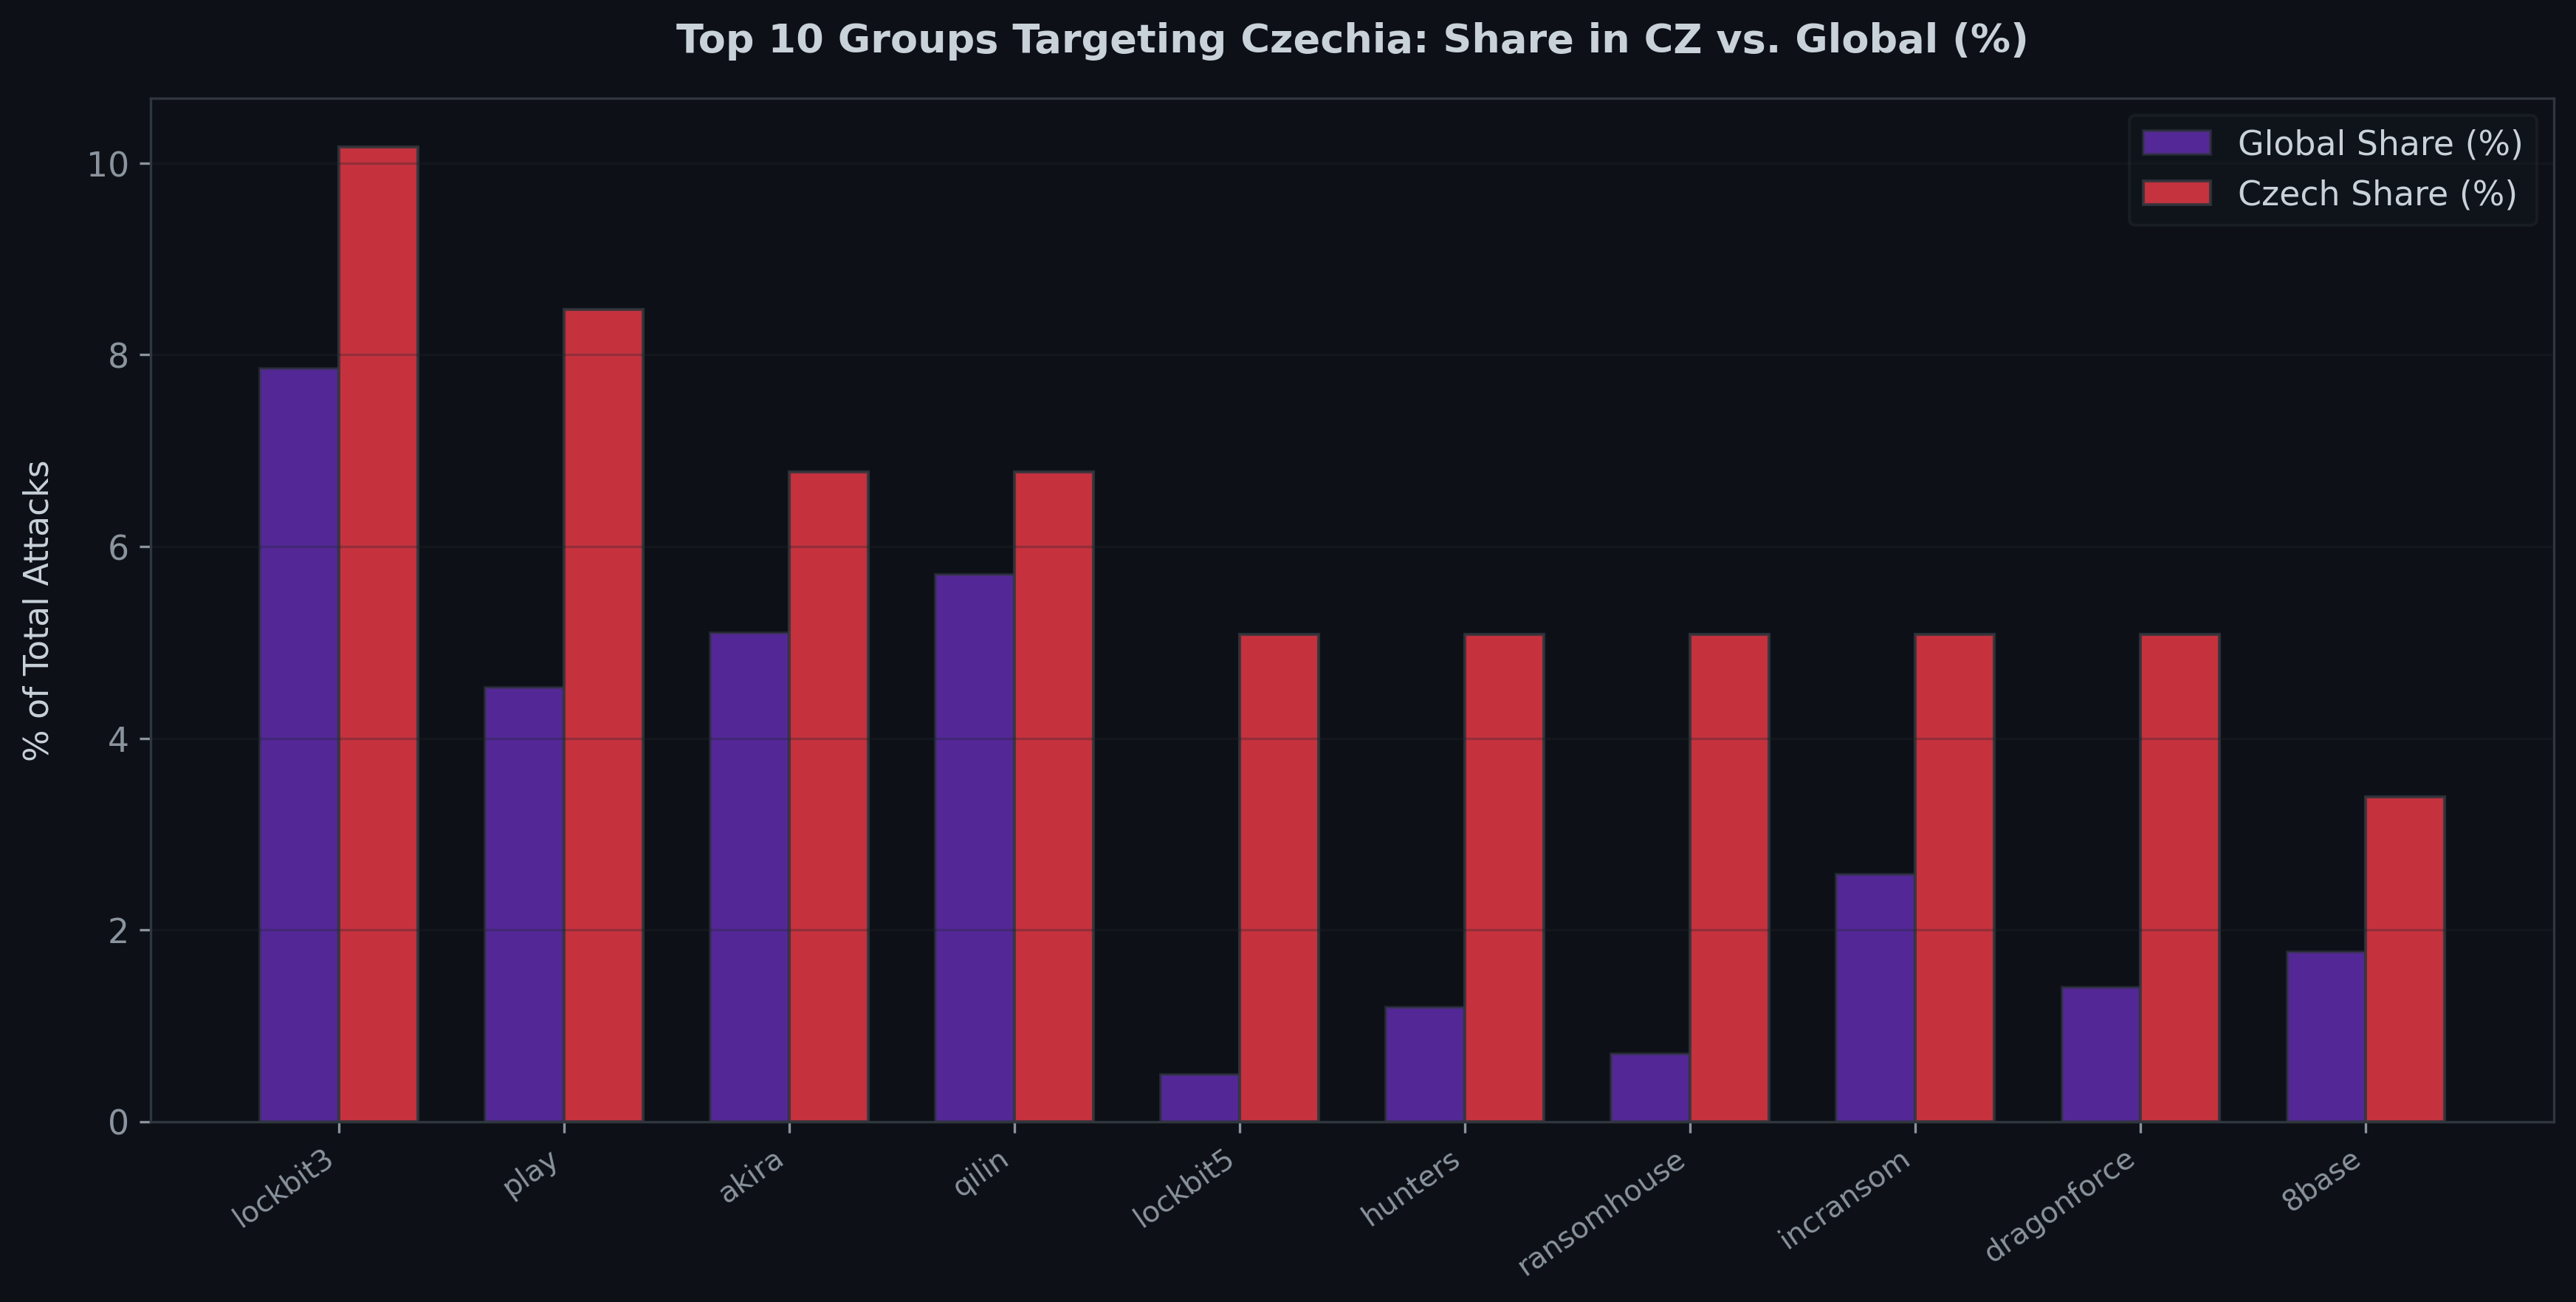
During the monitored period, 31 unique ransomware groups operated in Czechia. The five most active accounted for 37% of all incidents. Compared to global distributions, certain groups show a noticeably higher share in Czech data than in global averages. This may suggest that the Czech market is not an accidental destination, but part of a deliberately chosen operational focus.
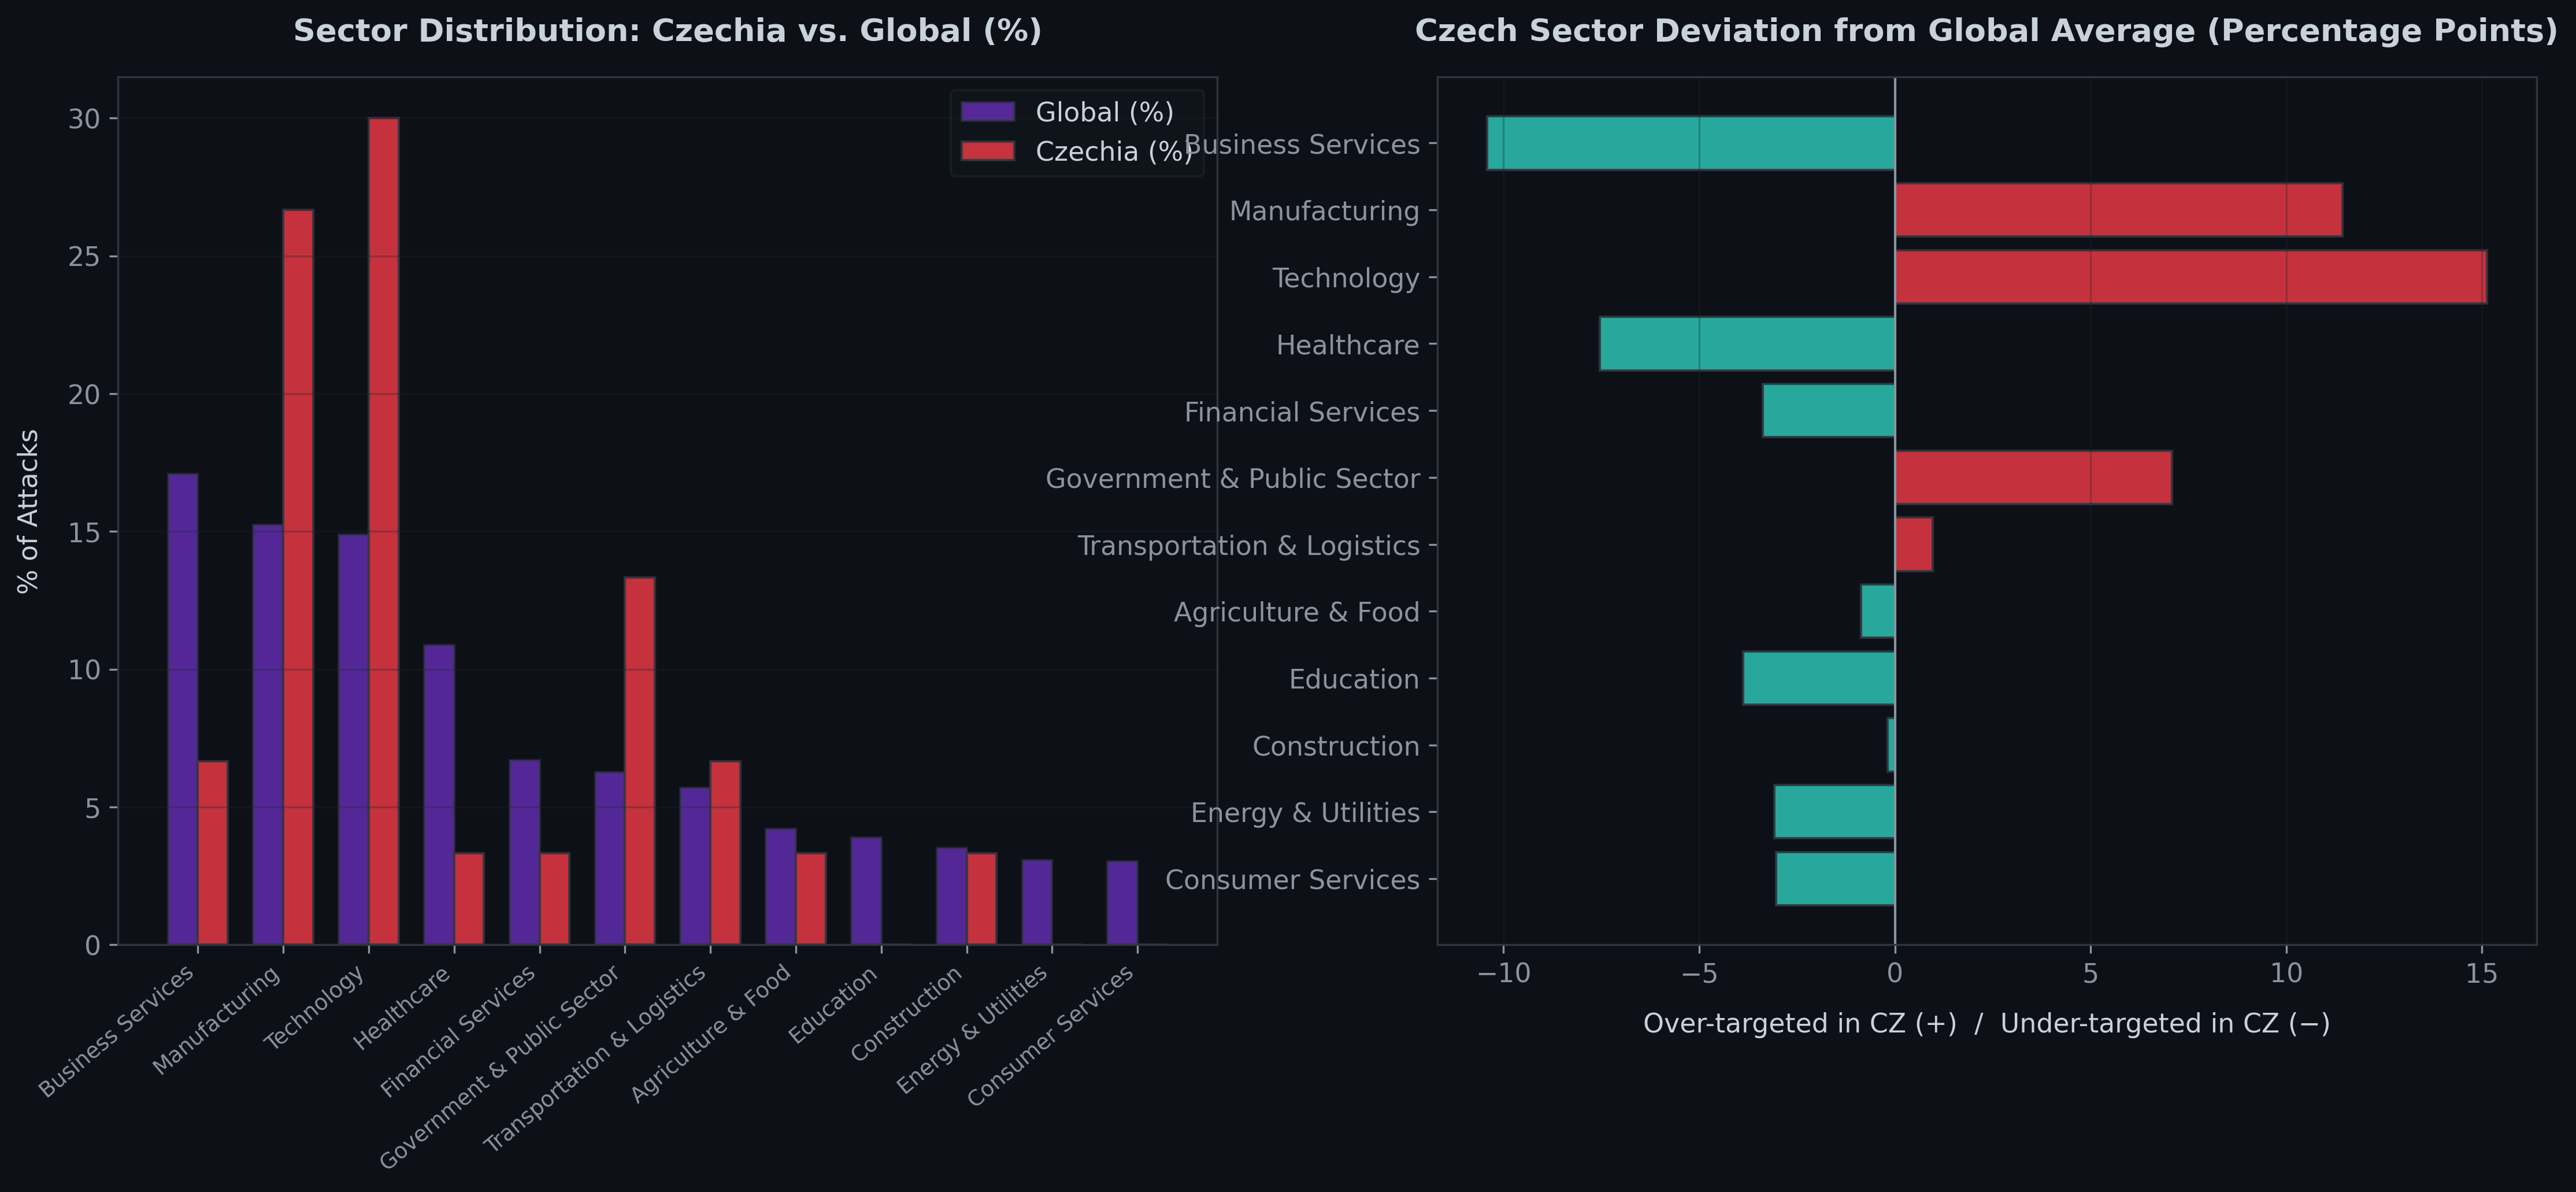
Technology companies and manufacturing enterprises are among the most frequent targets in Czechia: compared to the global average, these sectors have a higher share of attacks in Czech data. Conversely, companies in business services and healthcare were targeted less often in Czechia.
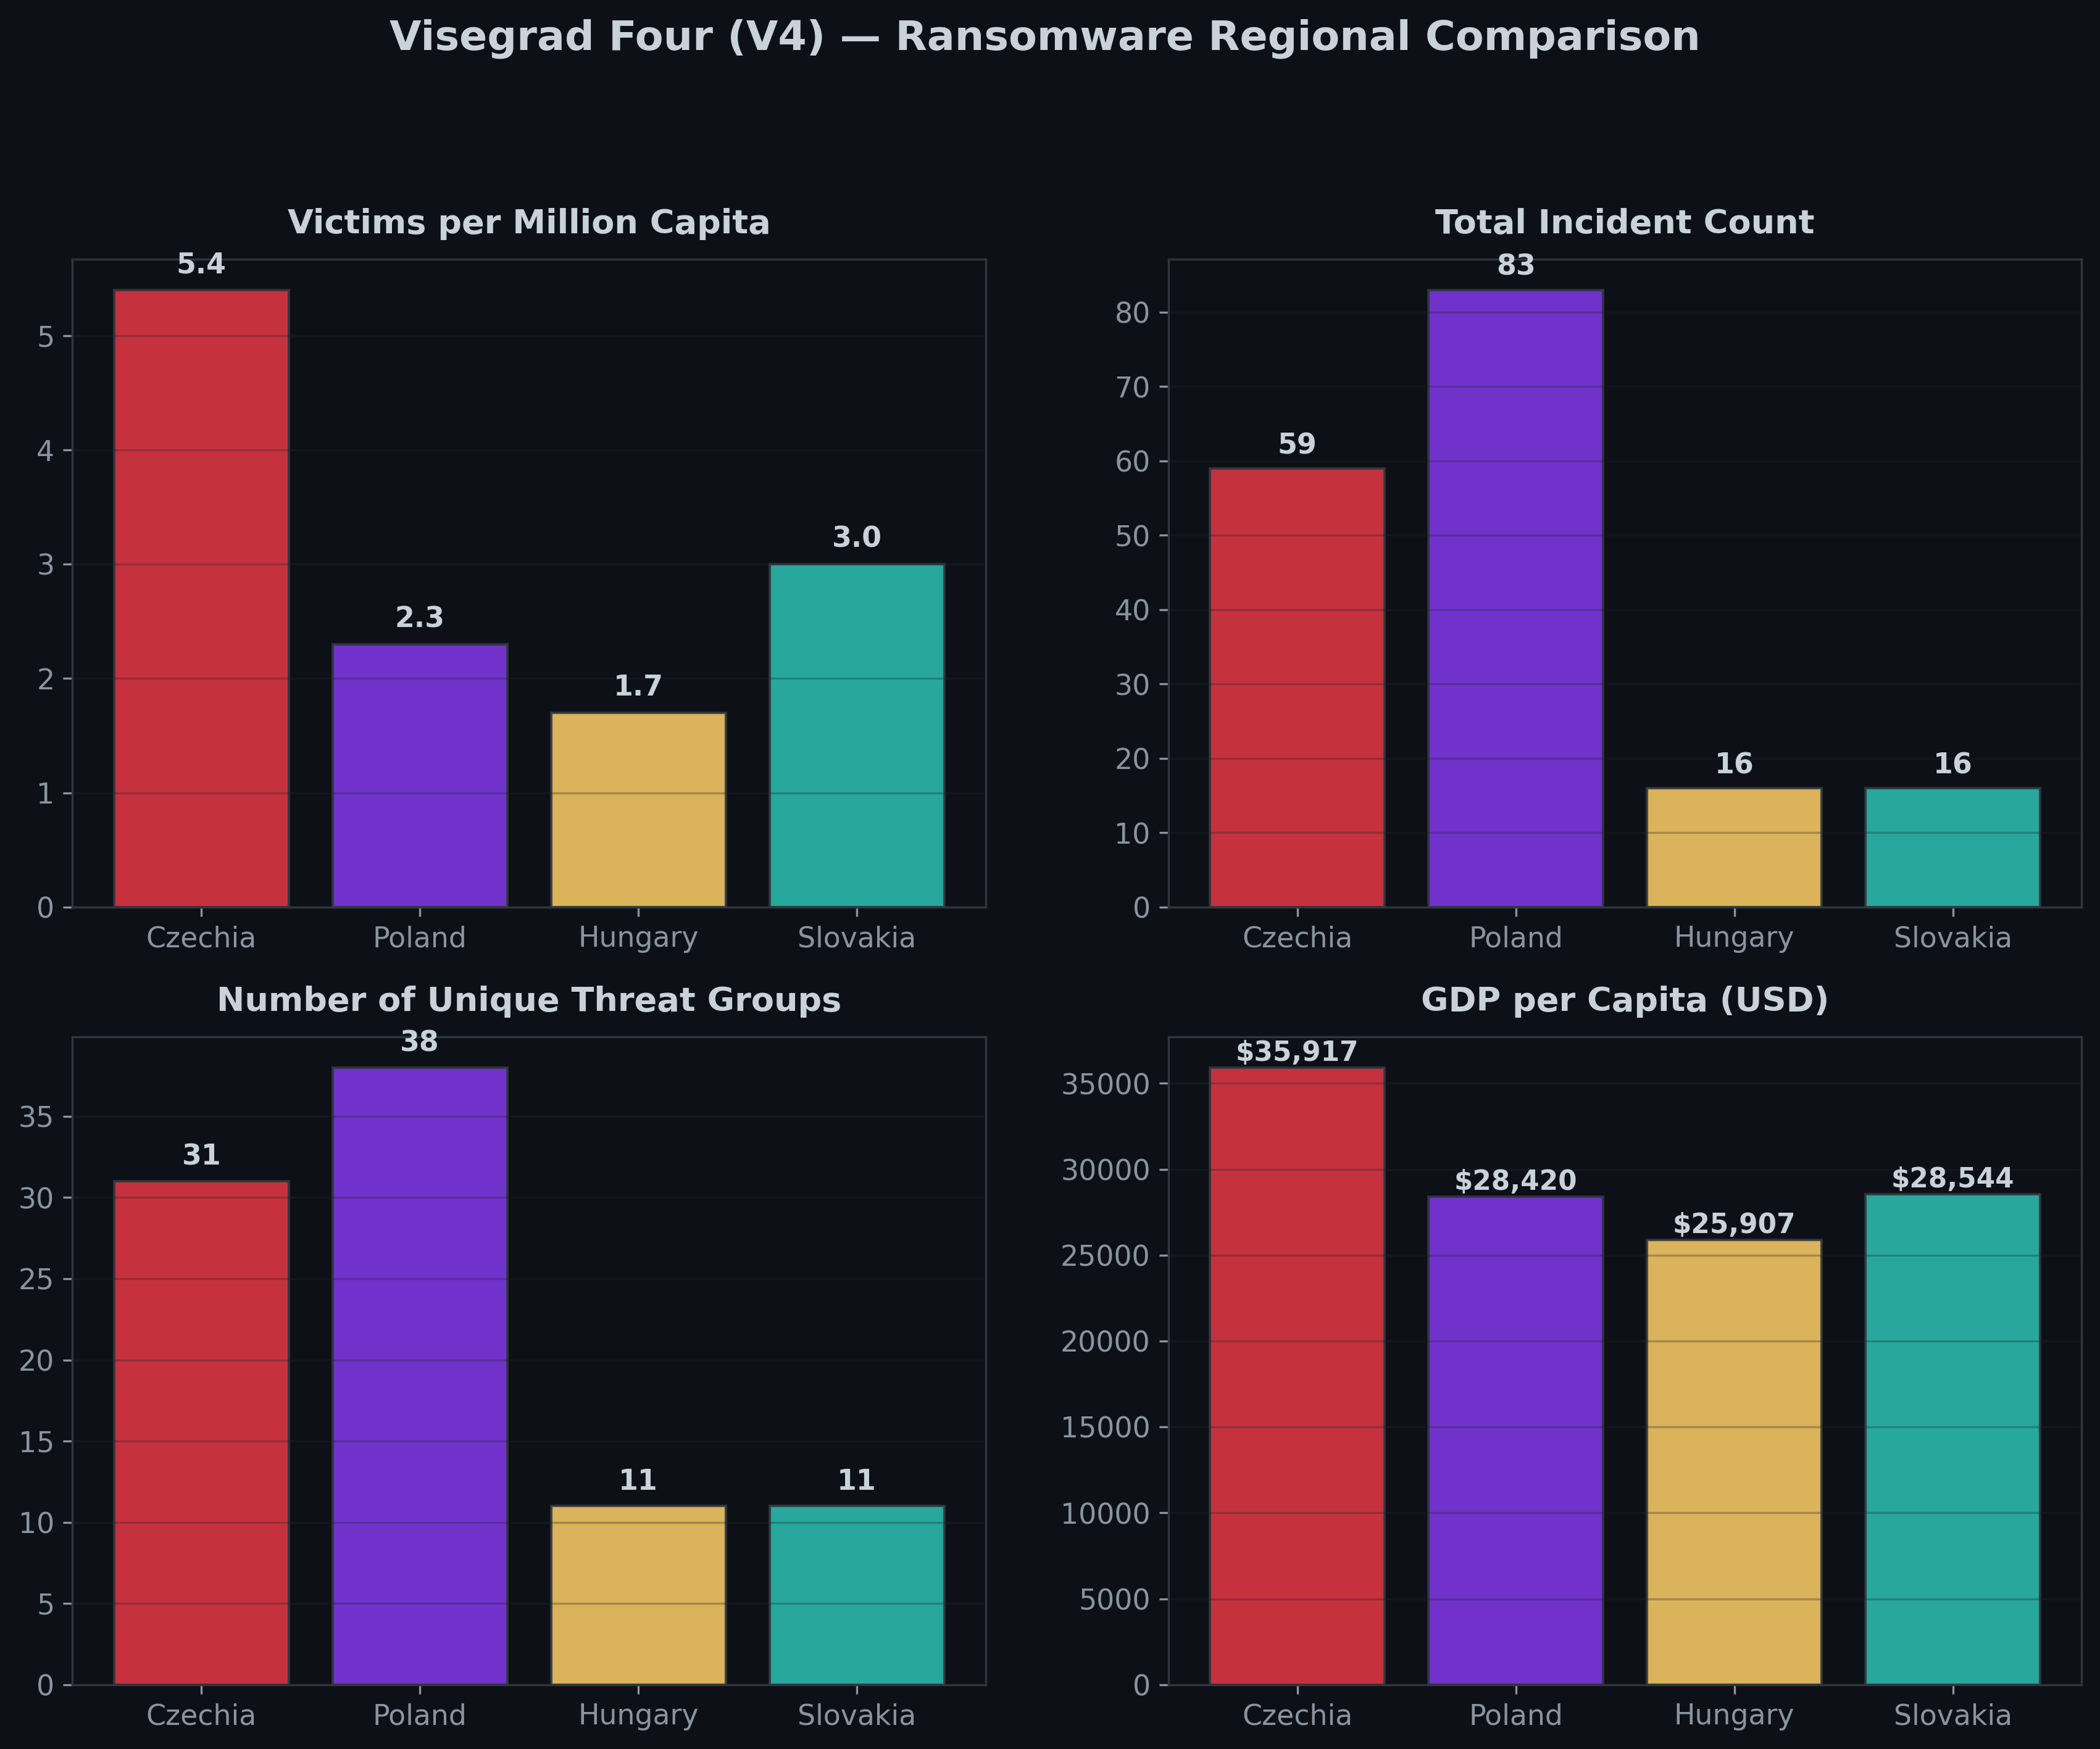
Within the Visegrad Four (V4), Czechia has the highest number of attacks per million residents at 5.4. It also holds the second-highest total volume of attacks and unique threat groups in the region.
Compared to immediate neighbors, Czechia sits in the middle: ahead of Slovakia (3.0) and Poland (2.3), but well behind Germany (8.5) and Austria (11.0).
9. Correlations with External Intelligence & Macro Signals
This section expands beyond incident logs to examine relationships between ransomware activity and external indicators.
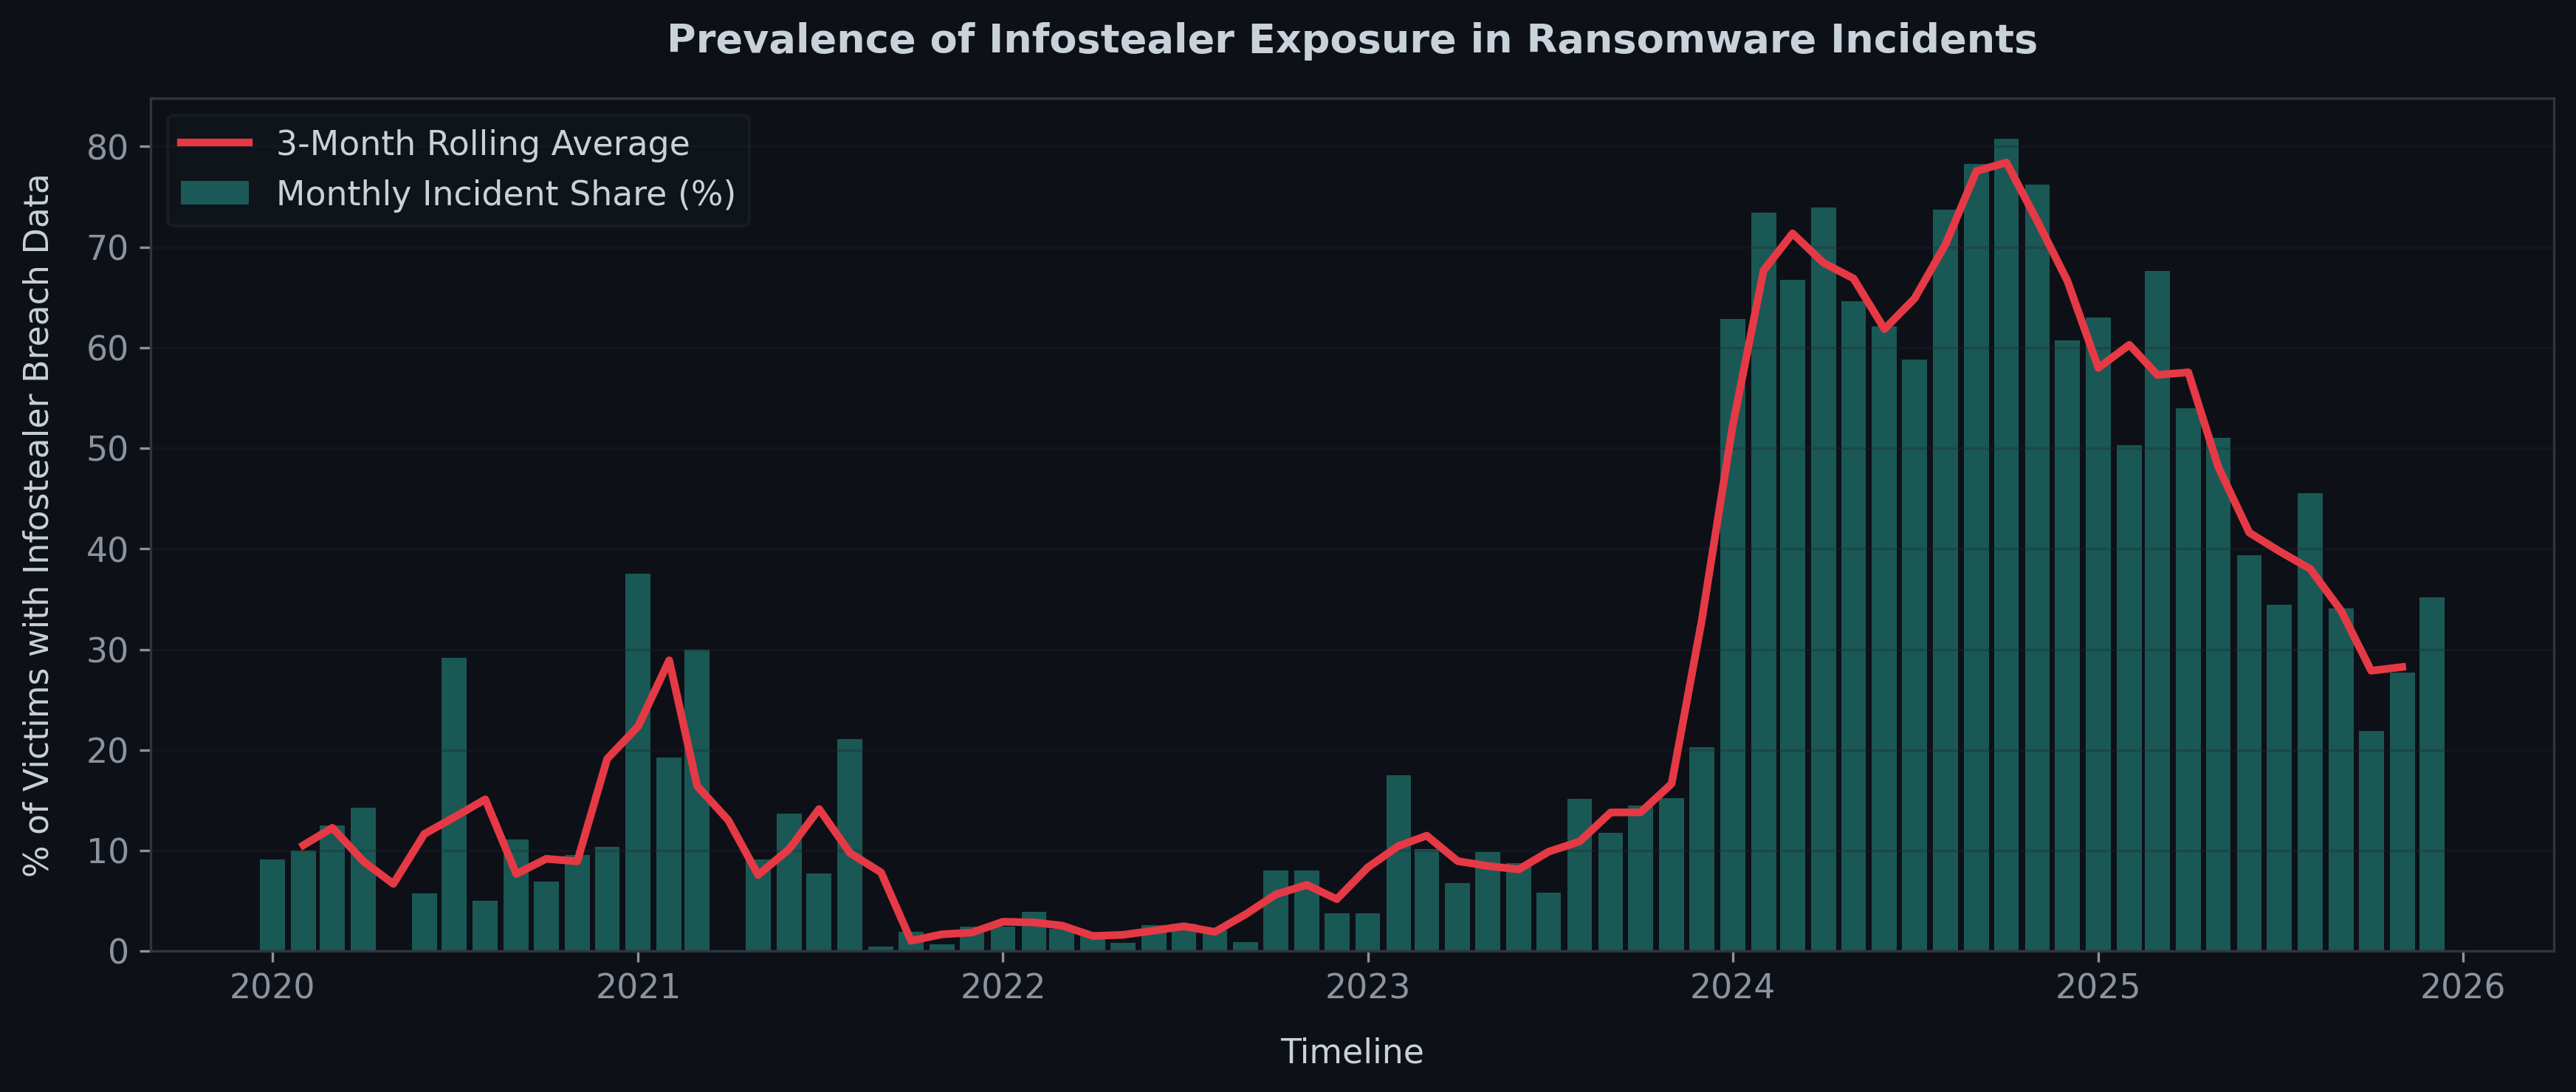
One notable detail is that for a portion of incidents, the dataset includes indicators suggesting prior compromise by an infostealer. However, this data comes from third-party sources, and it is not entirely clear whether these records tie directly to a specific ransomware attack or simply to general credential leaks associated with the victim’s domain. For this reason, this information was not included in the main analytical conclusions.
Nevertheless, three commodity stealer families clearly dominate: RedLine, Lumma, and Raccoon make up roughly 75% of observed detections. The data also suggests that over the course of 2025, the share of incidents linked to infostealers gradually declined.
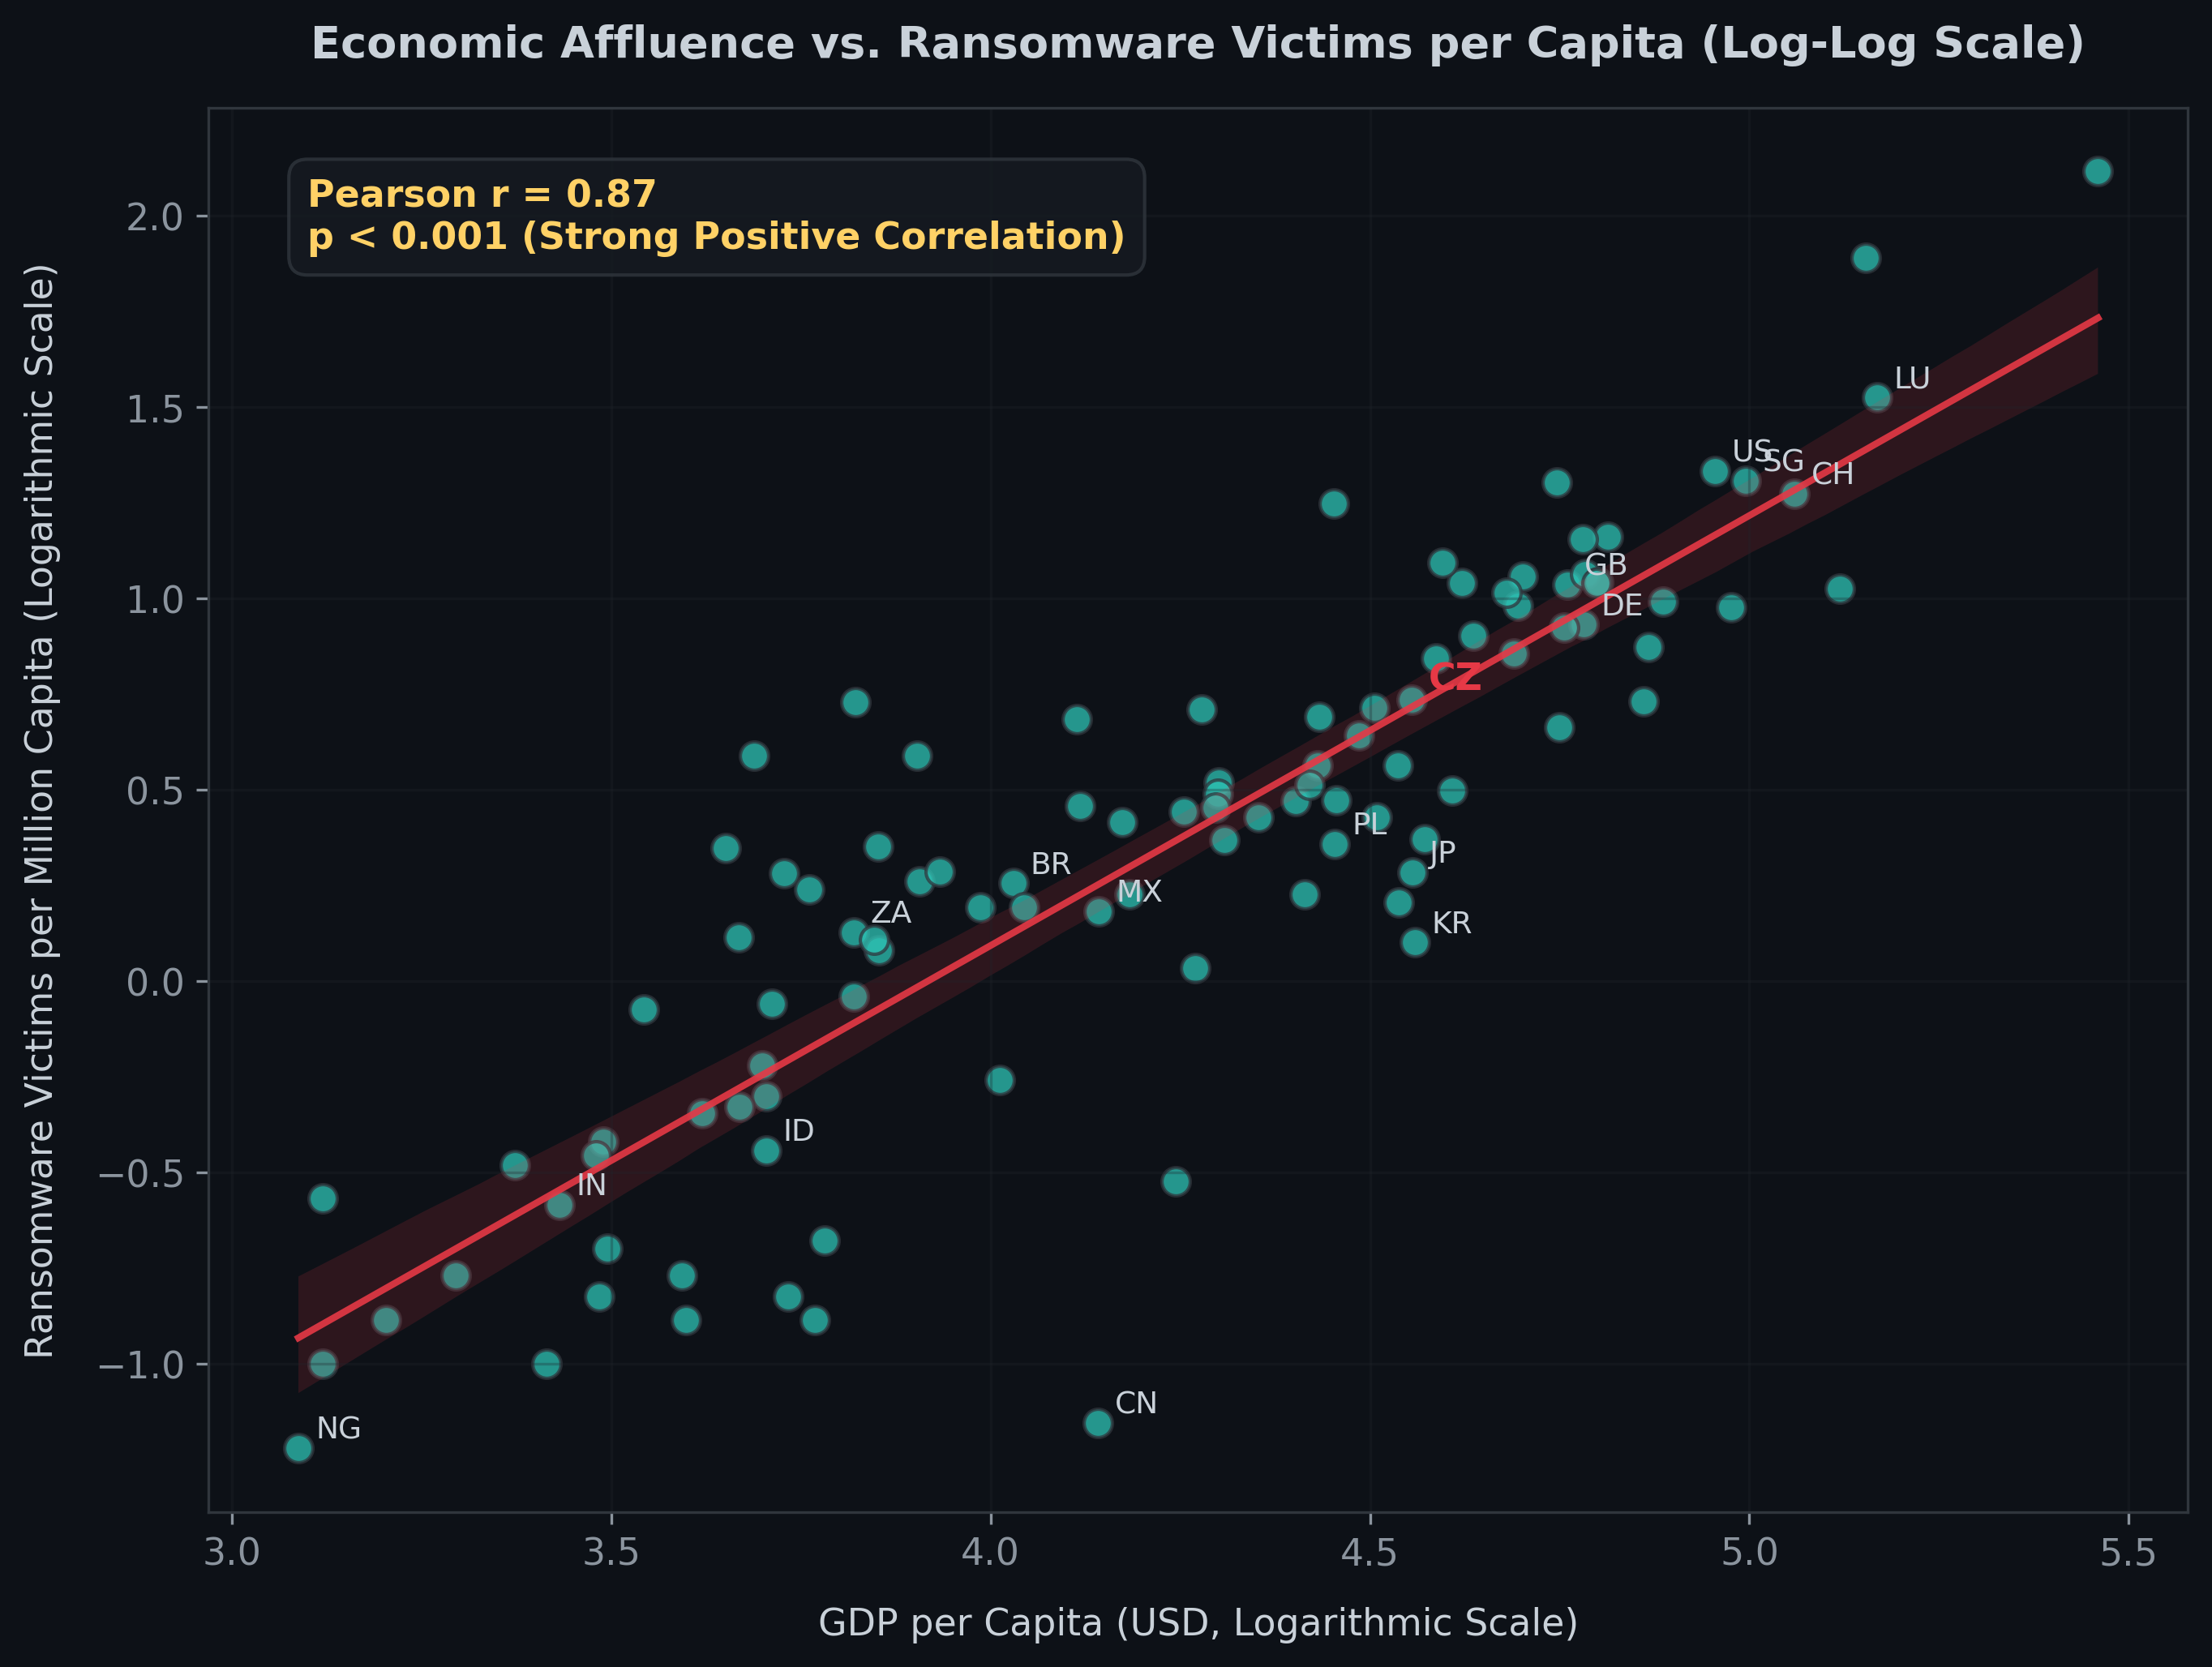
The data also confirms a very strong positive correlation between national economic development and the number of ransomware victims per million residents (r = 0.87). Wealthier nations are targeted far more often in the data, reflecting both higher digitization and greater economic appeal for attackers. The following chart illustrates this, with both axes plotted on a logarithmic scale to allow comparison across widely varying values and better reveal the overall trend across orders of magnitude. Population and GDP data were obtained from api.worldbank.org.
10. Conclusion
Ransomware has long ceased to be a matter of a few lone hackers in hoodies. What we see in the data today resembles a functioning market sector: dominant players, seasonal cycles, a Monday-to-Friday working week, and price negotiations guided by the same commercial logic as any other business. Attackers know whom to target, when to strike, and how much to ask for to maximize the chance of payment.
One of the most important takeaways is the degree of concentration. A small handful of groups accounts for a substantial share of incidents. When one of them disappears, whether under pressure from law enforcement or due to internal conflicts, its place is filled surprisingly fast. The ecosystem is resilient precisely because it operates as a market, not a hierarchy. Nor is victim selection accidental: wealthier countries, digitally dependent industries, and organizations with sensitive data and limited tolerance for downtime are targets that make economic sense to attackers.
Czechia in this picture is neither a blind spot nor a primary target. It is part of the global playing field, with its own profile and vulnerabilities. That is why we should look not only at what happens behind our own gates, but at how this entire market functions. Understanding the attacker not as an abstract threat, but as a rational actor with their own strategy, is the first step toward defending smarter: not more, but better.