Live from the Bedroom: When We Stream Our Private Lives Online
A large-scale analysis of publicly accessible internet-connected cameras using AI and network metadata, uncovering privacy risks, global exposure patterns, and real-world implications of misconfigured IoT devices.
The materials presented in this article are derived from publicly accessible data indexed by services Shodan. No authentication bypassing, exploitation, or unauthorized access techniques were used to obtain this information.
All images have been anonymized to remove or obscure any potentially identifiable personal data, in accordance with applicable data protection regulations, including the General Data Protection Regulation (GDPR). The content does not aim to identify any individual, household, or organization.
This article is intended solely for informational, educational, and cybersecurity awareness purposes. The author does not endorse or encourage unauthorized access to systems.
If any individual or entity believes their rights or privacy have been affected, they are encouraged to make contact for immediate review and possible removal of the relevant content.
Live from the Bedroom: When We Stream Our Private Lives Online
Webcams are widely used for everyday purposes such as monitoring homes, checking on pets, supervising workplaces, or observing public spaces. Most of these use cases are completely legitimate. However, not all devices are configured securely, and some end up being publicly accessible without the owner’s awareness.
While working with Shodan data, I noticed that screenshots from these webcams appear quite frequently. Looking at a few manually is fine. Looking at thousands quickly turns into a very boring job. And since we live in the AI era, manually browsing tens of thousands of images felt like unnecessary suffering. It made much more sense to let a model do the repetitive work instead.
So I collected publicly accessible webcam screenshots from Shodan. The initial dataset contained 29440 records with images. During download, some images indicated by the API were missing, suggesting that Shodan performs some filtering or that certain images were no longer available.
Data cleaning
After downloading, the dataset was cleaned in two stages. First, simple hash-based deduplication was used to remove identical images, reducing the dataset to 26903 unique images. Since many webcams produce nearly identical frames, a second filtering stage was applied using PIL (Python Imaging Library) and perceptual hashing. Each image was resized to a small resolution, converted to grayscale, and transformed into a small visual fingerprint based on overall shapes and brightness. Similar fingerprints were compared using a small threshold, and near identical images were removed. After filtering, the final dataset contained approximately 21500 unique images.
LLM role
Filtered images were then analyzed using a local Qwen2.5-VL:3B model running via Ollama. While more capable models exist, this model was selected as a practical tradeoff between performance and processing time given the dataset size. The model was given a simple task:
- Analyze a webcam image
- Determine if image is usable or unusable
- If unusable → return fixed JSON with all null fields
- If usable → classify into one predefined place
- Ensure place matches correct category and score
- Extract up to 5 visible object nouns (lowercase, no people descriptions)
- Write short description (max 100 characters)
- Detect sensitive content worth checking and set optional flag
- Return only a valid JSON object
- No explanations, no extra text
With an average analysis time of about 30 to 45 seconds per image, processing the entire dataset took … a while. Long enough to start browsing new GPUs and pretending it’s a necessary investment … and also wondering why I thought this was a good idea. Anyway, with the analysis finally done, let’s explore what the AI discovered.
Analysis
Manual data quality check
Before diving into the full dataset, I manually reviewed a small sample of the results. Twenty images were selected from each category, and surprisingly, the LLM was not completely off in any of them. While the sensitivity scoring and object detection could be improved in some cases, there were no major misclassifications. During this validation step, a few technical issues also appeared, such as broken JSON responses or fields placed incorrectly, but given the scale of the dataset, these were expected and relatively minor.
On the other hand, I also realized that my prompt design was probably a bit too restrictive, or simply not formulated in the best way (clearly, my prompt engineering still has room for improvement). This likely influenced the model’s behavior, as the LLM tended to prefer categories and scores that appeared in the examples, a known effect in prompt engineering often referred to as example bias or anchoring.
At the same time, I used a low temperature setting to keep the JSON output stable and avoid formatting issues. While this helped maintain structure, it also made the model more deterministic and less likely to explore alternative classifications. That said, the category lists and examples were still reasonably broad, so the results remain interesting and useful even if the model occasionally played it a bit too safe.
Dataset overall discovery
In total, about 21500 images were analyzed, with roughly 21000 usable and around 500 unusable cases (e.g., blurry, blank, or damaged images). The model identified 141 unique places, flagged 107 images as interesting for further review, and detected 137 dominant unique objects (50241 in total). Overall, most captured scenes leaned toward lower-risk environments while still providing a meaningful portion of higher-sensitivity cases which is exactly the stuff we’re actually hunting for.
Privacy scoring Overview
As mentioned, I used AI-based scene analysis to classify environments and assign a privacy risk score to each image. The idea was simple: outdoor scenes usually mean low risk, while indoor environments, especially workplaces or home areas, tend to increase privacy exposure.
One important note: the AI scoring ended up using only a few specific values. This probably happened because I provided example scores in the prompt, and the model followed them quite literally. Combined with low temperature settings and prompt structure, this resulted in clustered values instead of a smooth distribution. And yes… that one’s on me.
Next, looking at the privacy score gives a clearer picture. Most cameras fall into the public category, which is expected, many exposed cameras simply show outdoor environments. However, a noticeable portion falls into moderate and highly private categories.
Finally, the second graph shows a simple category breakdown of where these cameras are located. Public outdoor cameras dominate the dataset, followed by indoor and professional environments. This aligns with the privacy scoring.
Geographic Insights
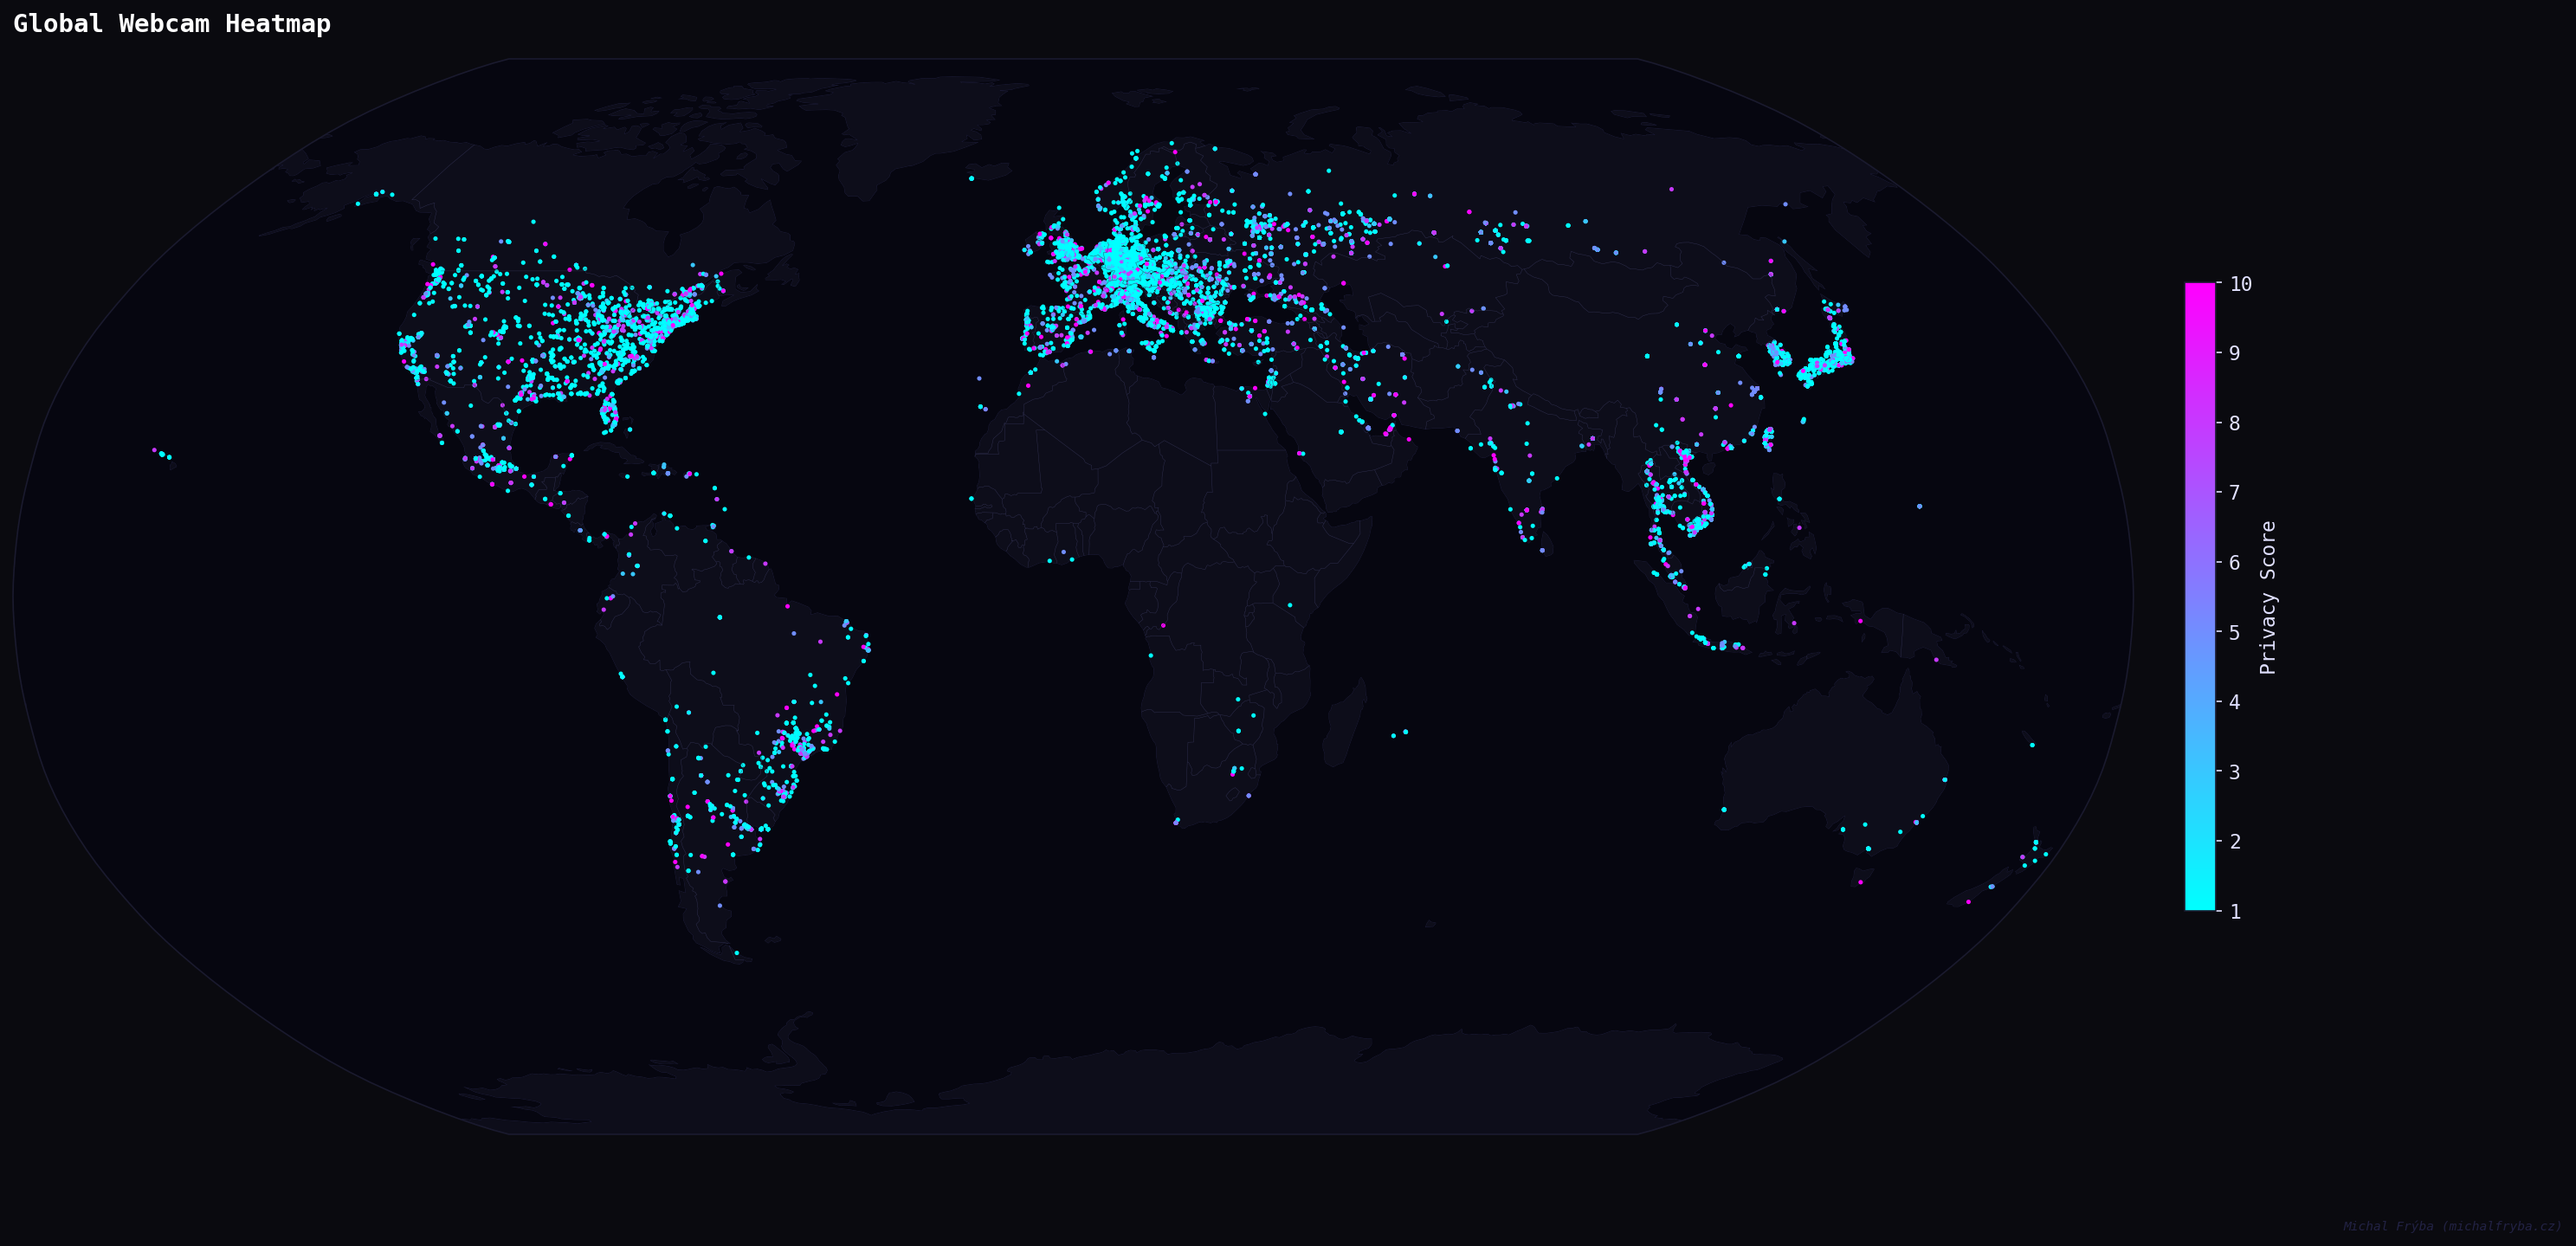
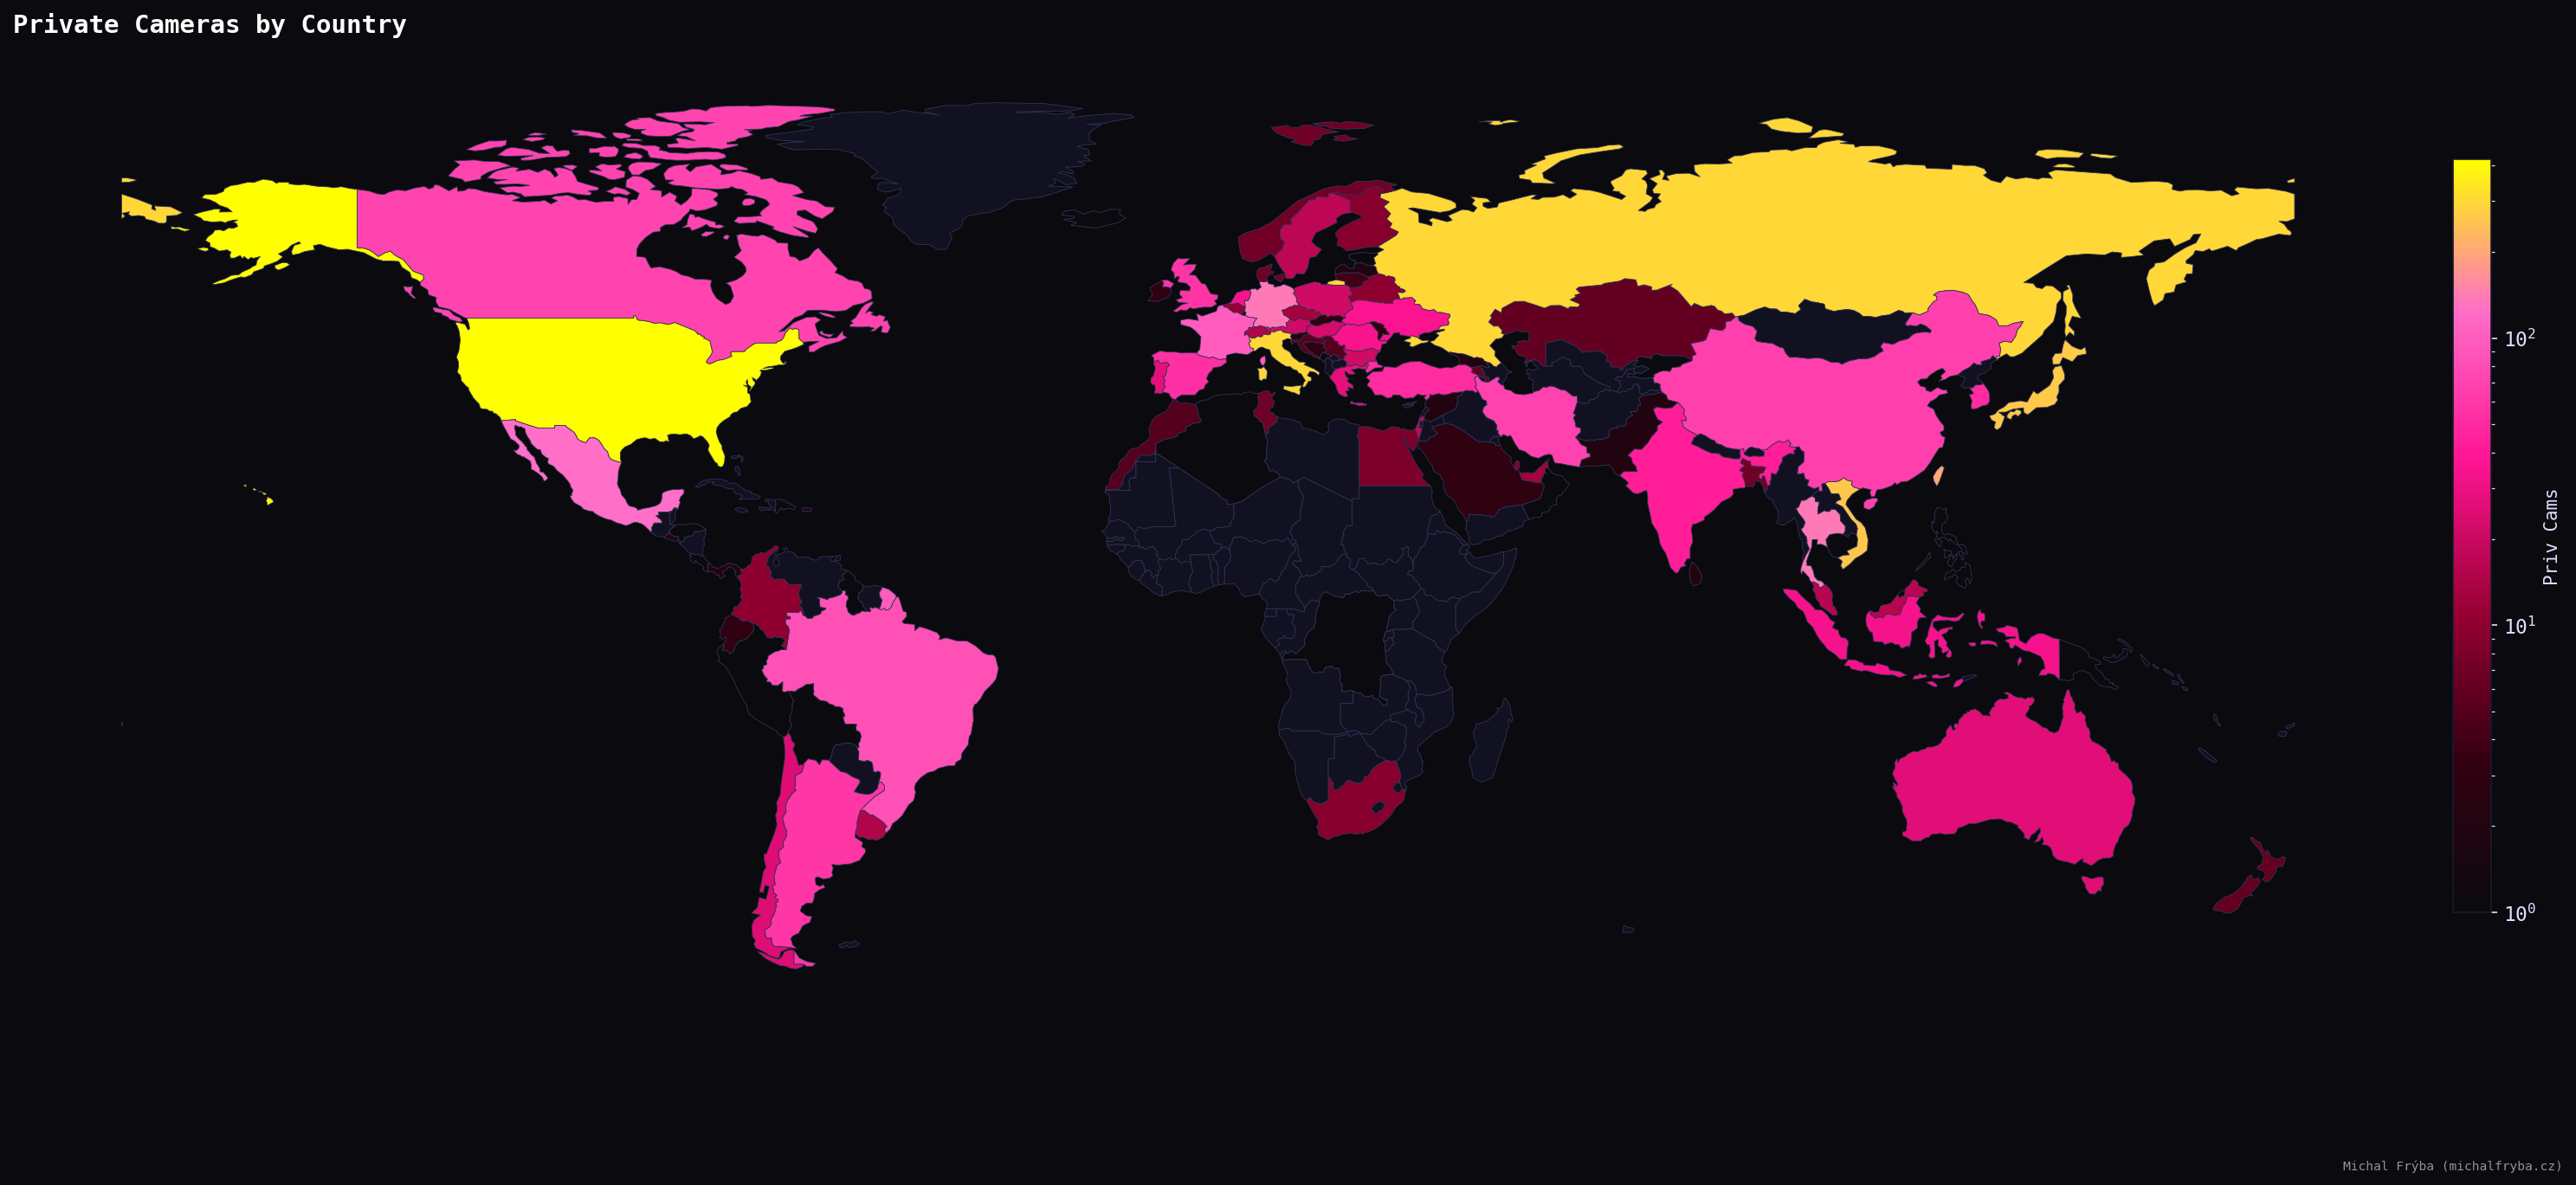
Exposed cameras appear across the globe, confirming that this isn’t a regional issue. North America, Europe, and parts of Asia show higher concentrations, likely reflecting higher adoption of connected devices. In short, more cameras = more chances someone forgot to change the default settings.
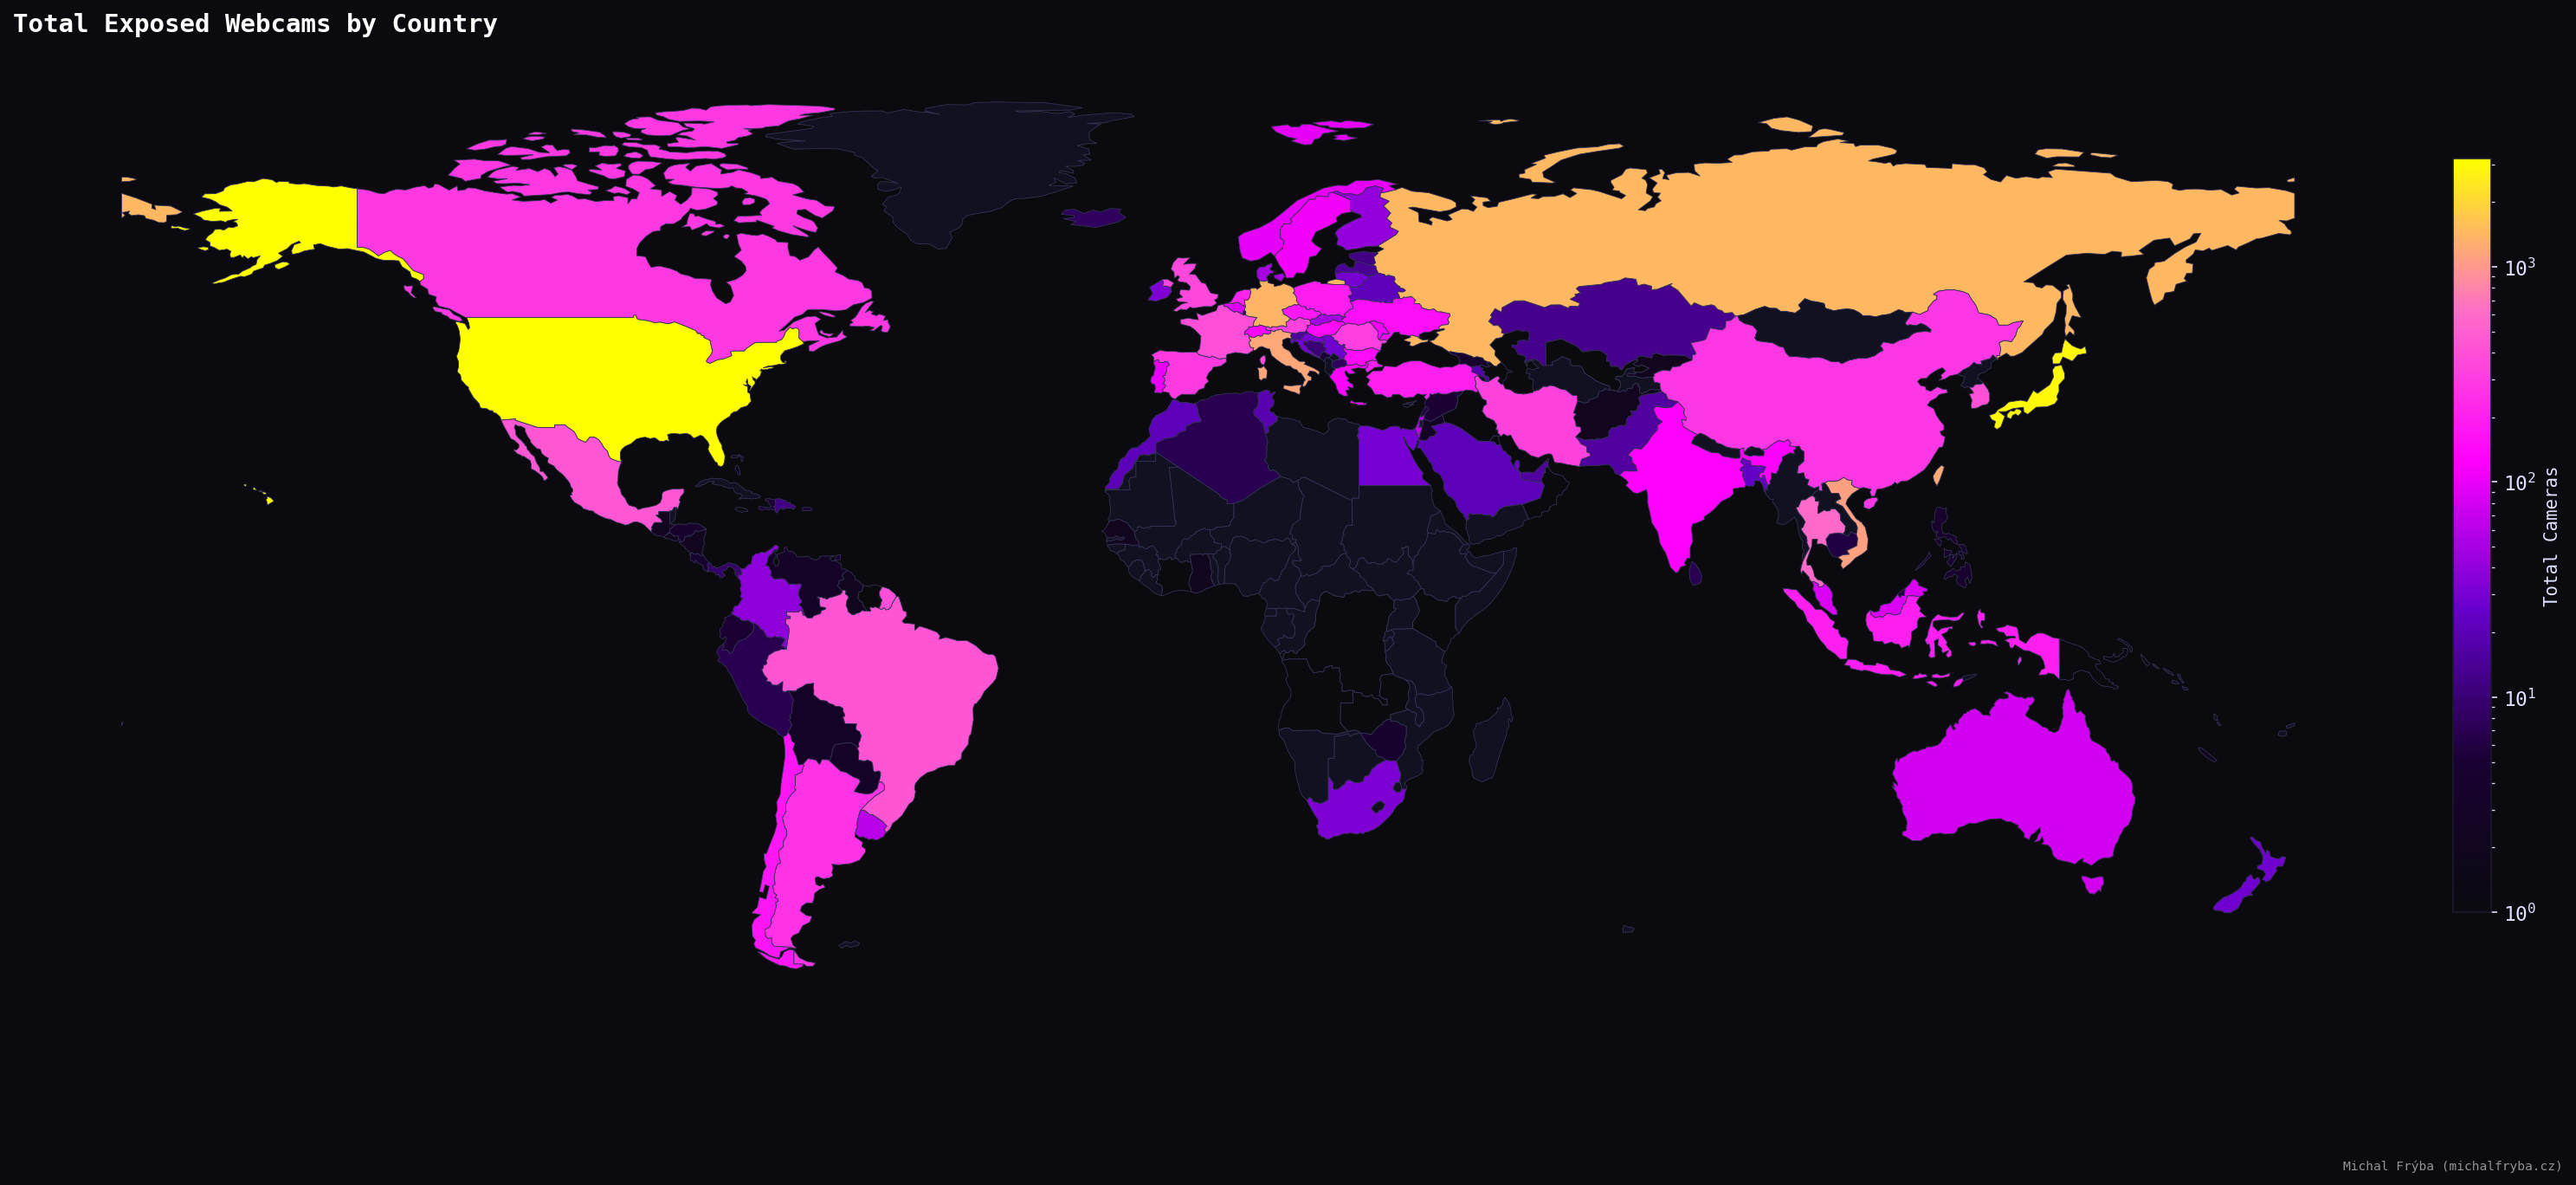
Shodan metadata also provides latitude and longitude, so naturally I plotted everything on a world map. Is there a groundbreaking insight here? Not really. Does it look cool? Absolutely.
Looking at the average privacy score reveals a slightly different picture. Some countries with fewer cameras still show higher average risk. However, using all countries directly produced some… questionable leaders (places with just one or two cameras suddenly appeared as the highest-risk regions). For example, countries like Isle of Man or Oman briefly topped the list, not because they are particularly risky, but simply because they had very few cameras, all of them scoring high. Statistically correct, but not very meaningful. The United Arab Emirates (UAE), however, is an interesting case, with 16 exposed cameras and an average score of 8.
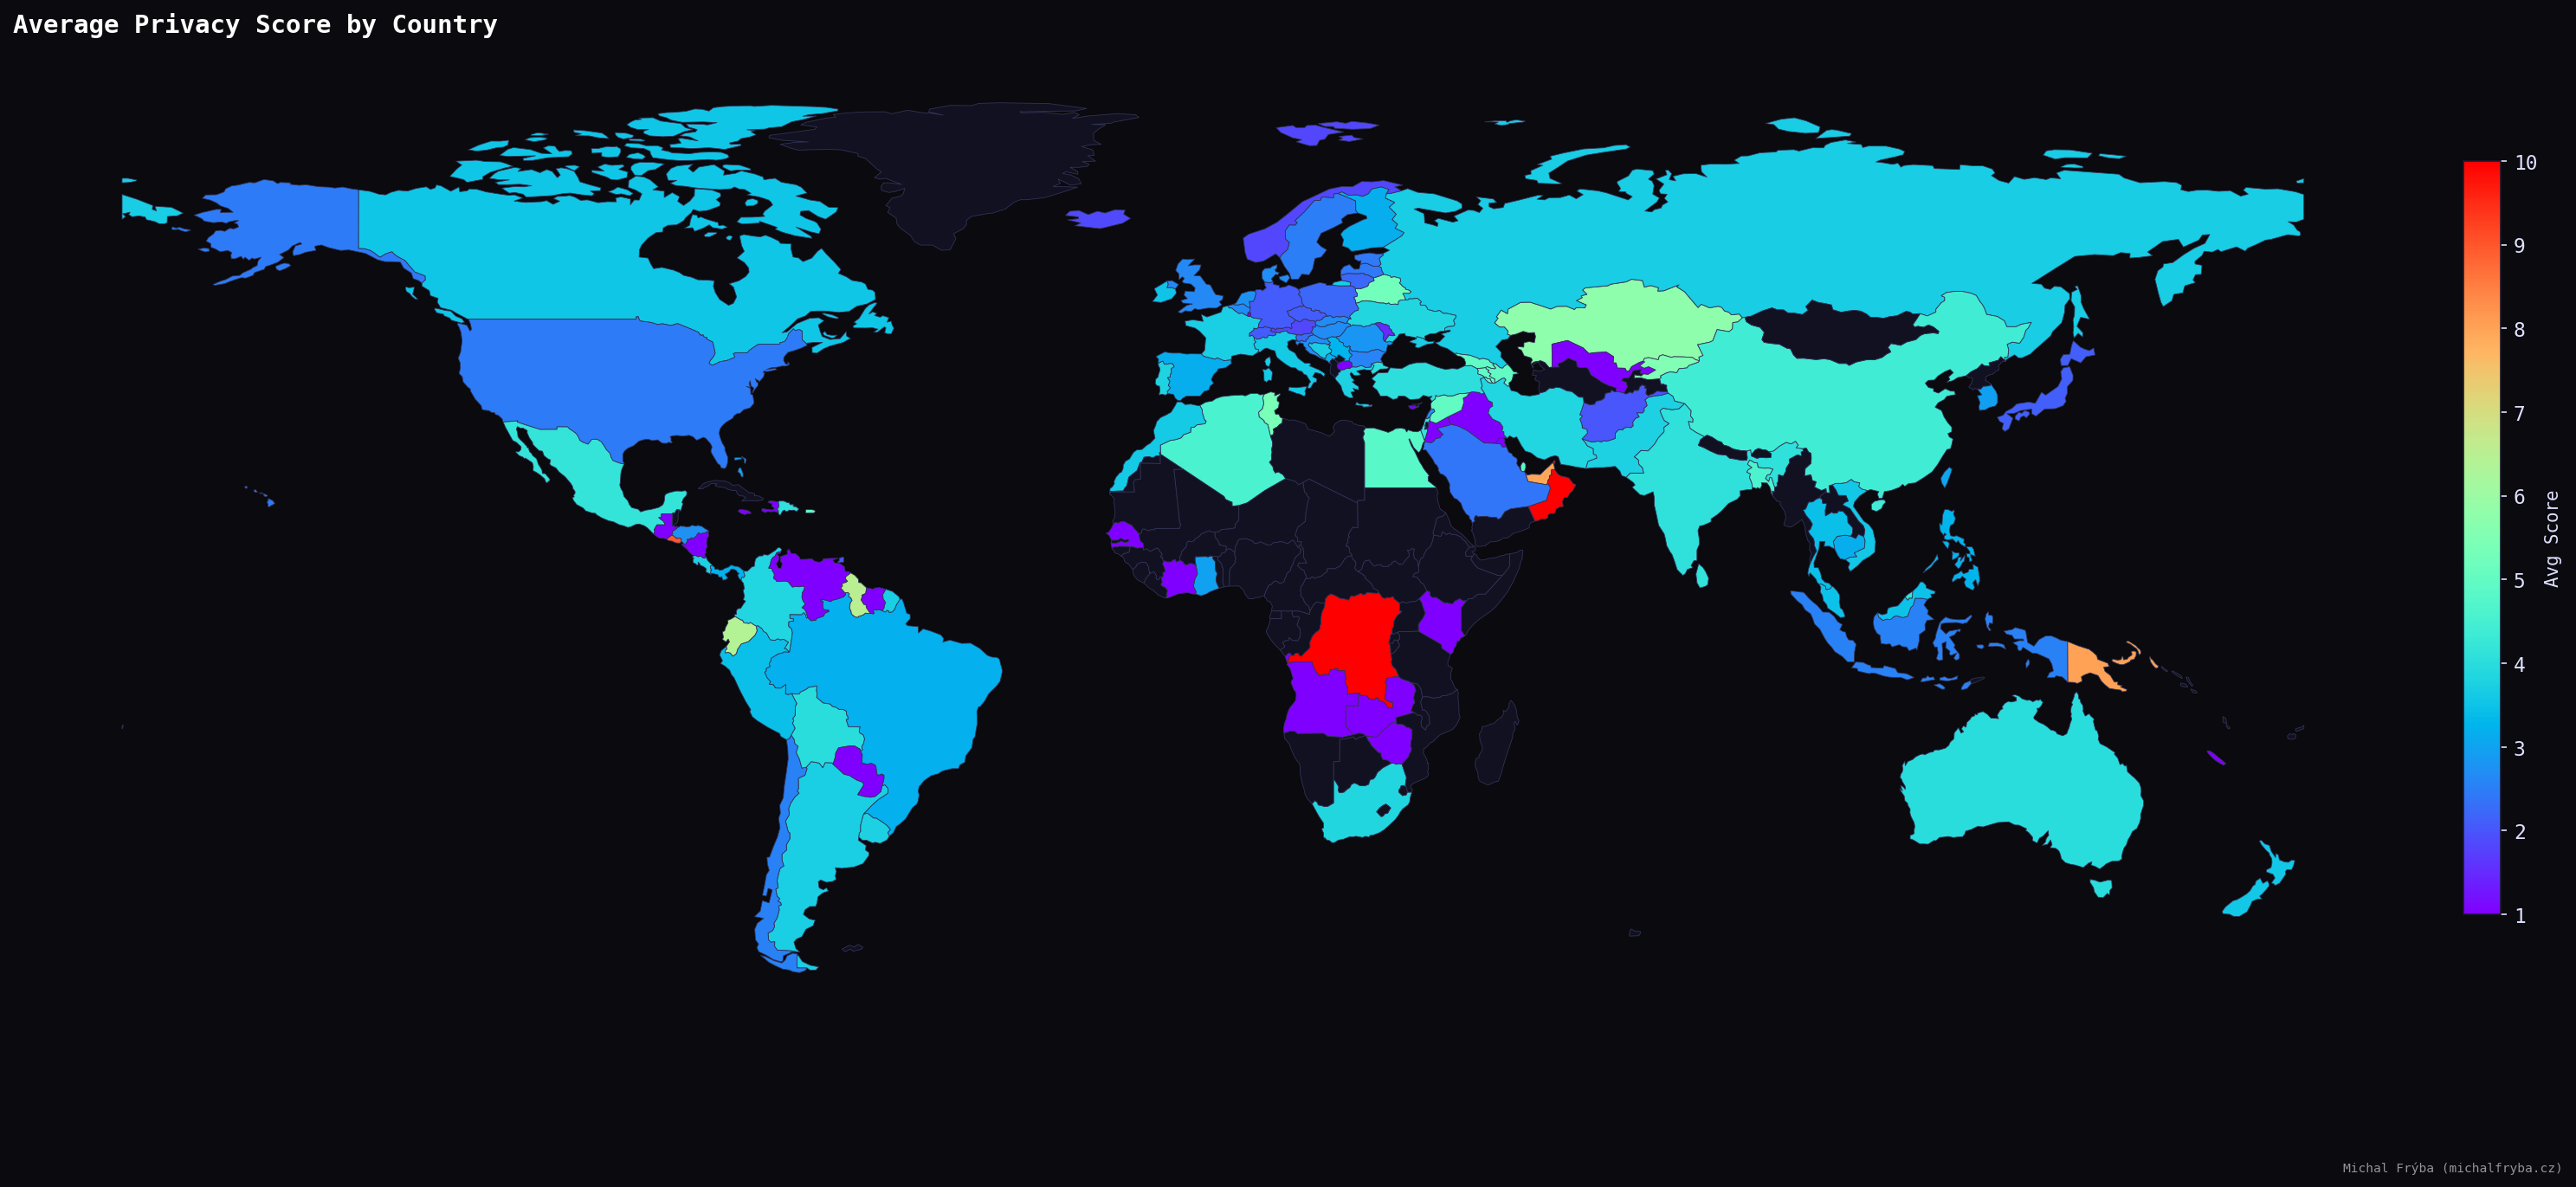
To make the results more reliable, I filtered the dataset to include only countries with at least 20 cameras. After applying this filter, a more realistic pattern emerges. Countries such as Singapore, Belarus, Qatar, Egypt, Bangladesh, and China show higher average privacy scores, suggesting a greater proportion of indoor or operational camera environments.
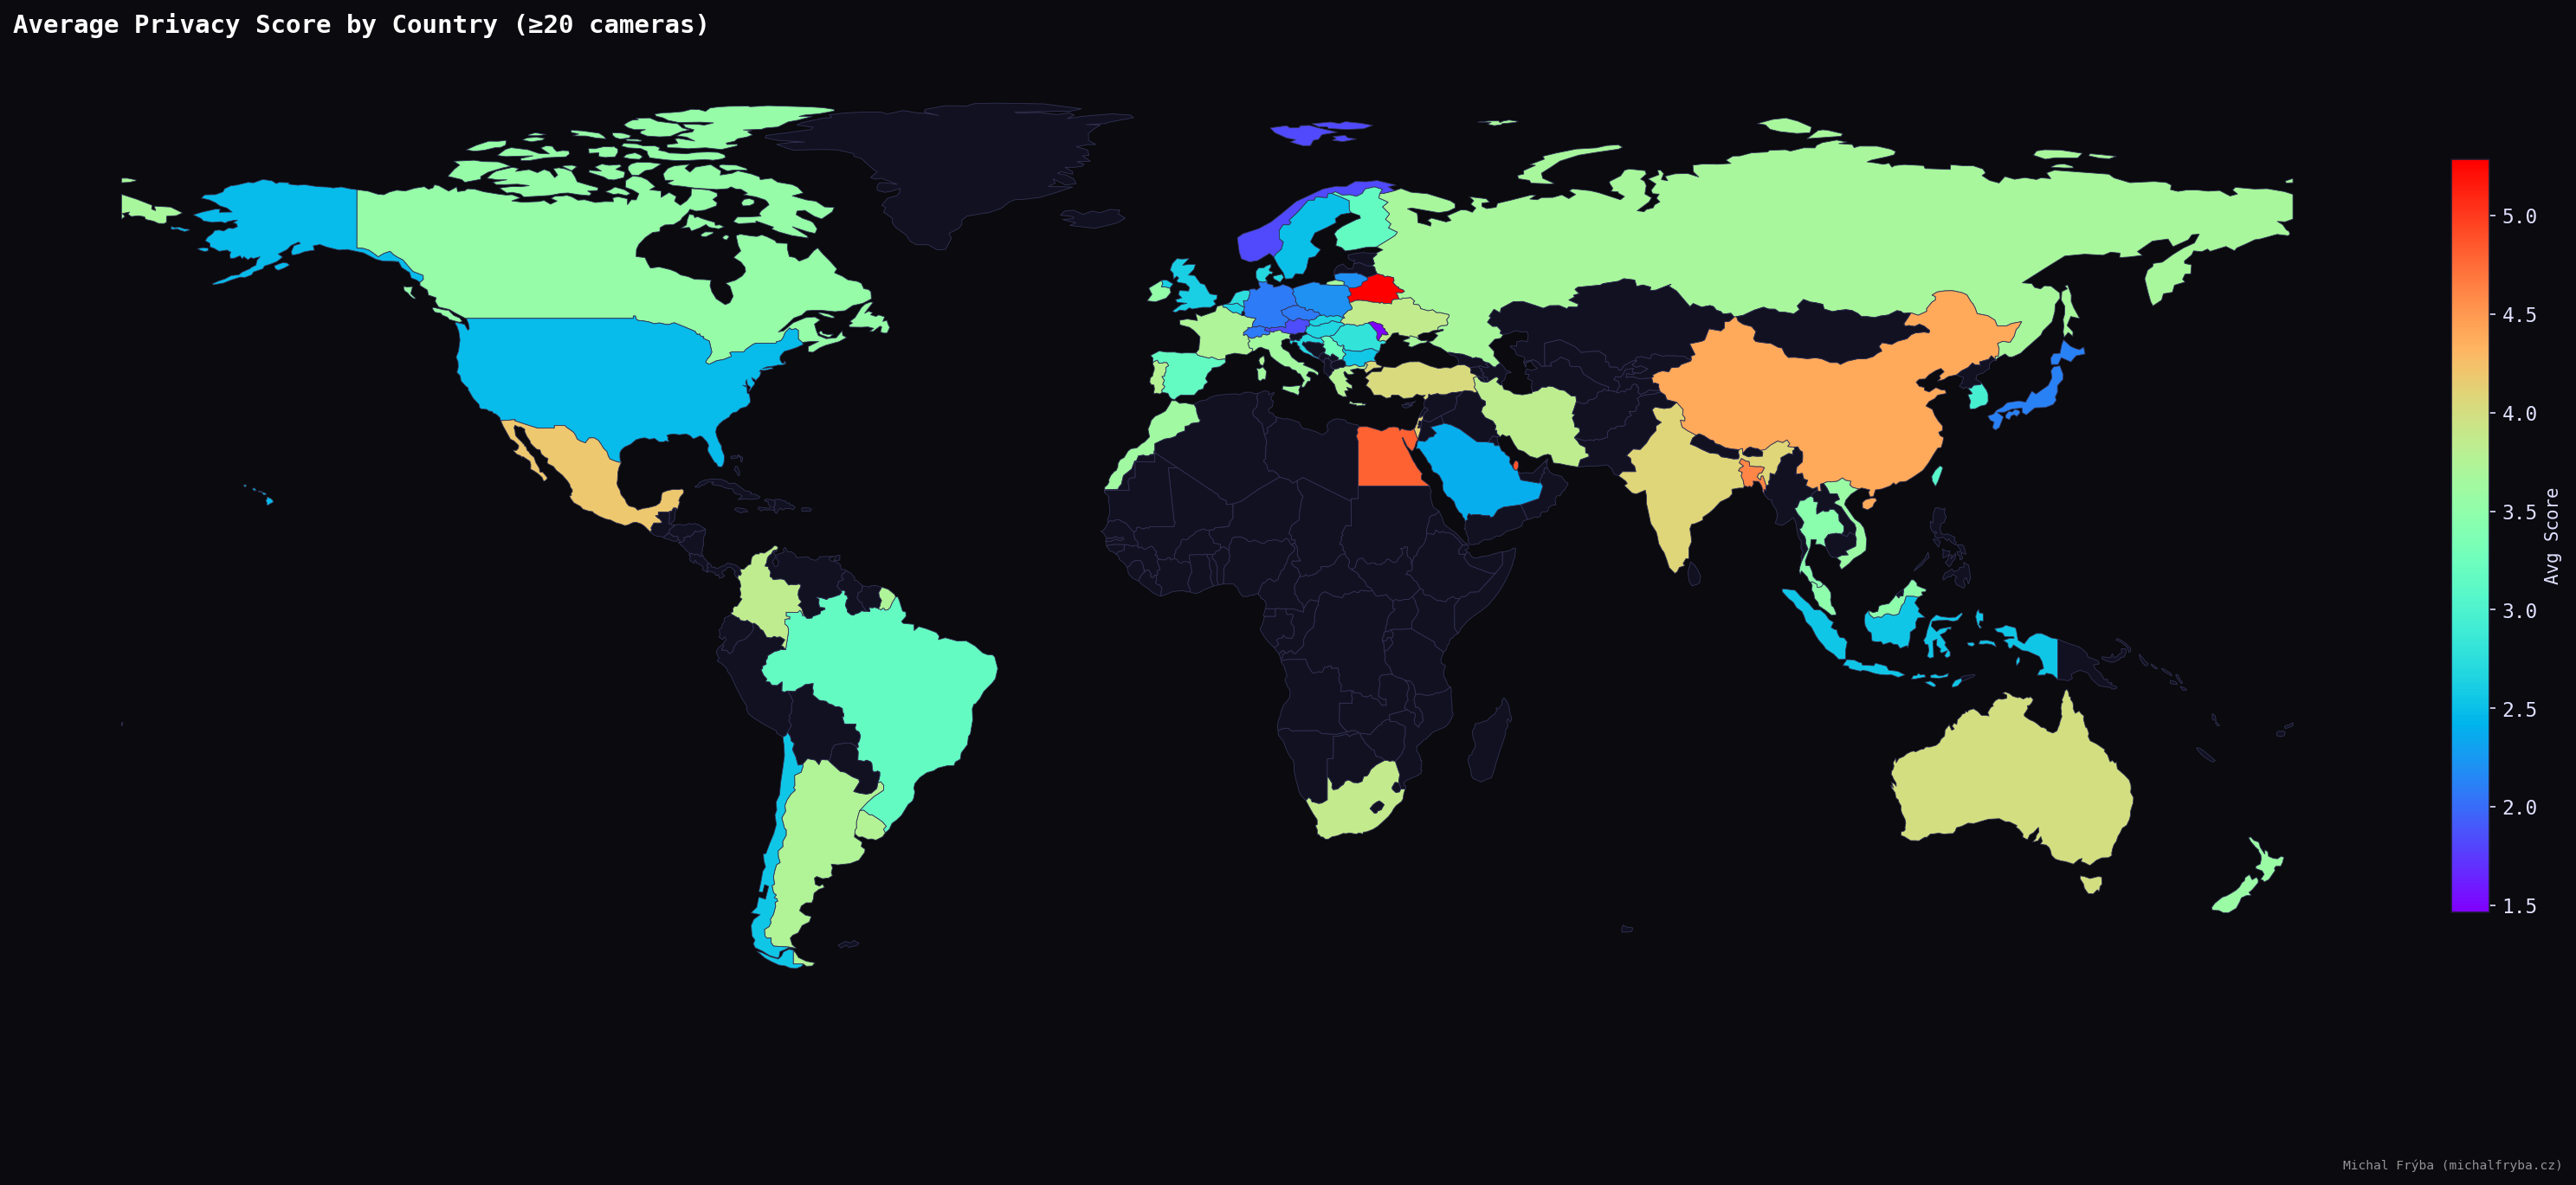
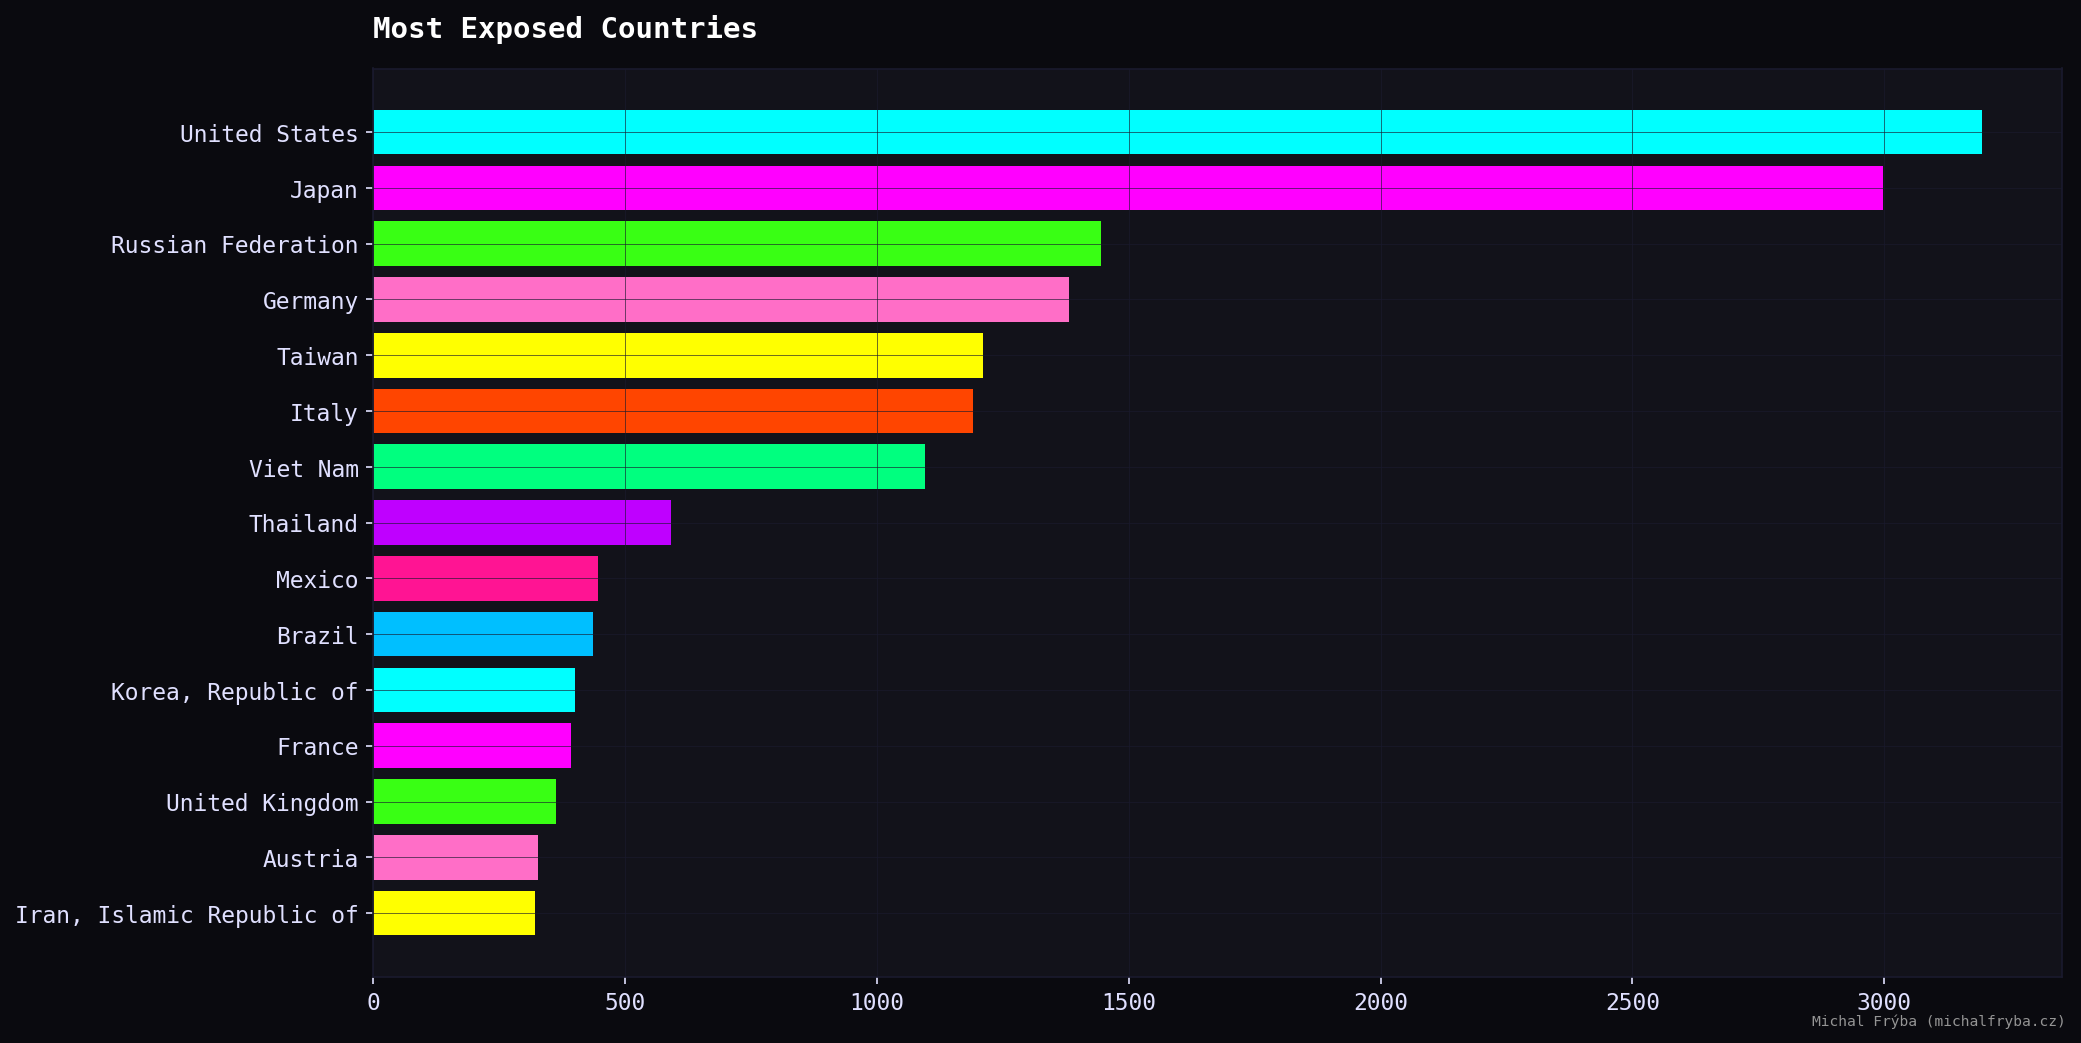
Focusing only on high-privacy cameras (score ≥ 8) reveals where the most sensitive exposures are concentrated. The United States leads by a noticeable margin, followed by Russia, Italy, Japan, and Vietnam. Other countries with significant numbers include Taiwan, Thailand, Germany, Mexico, and France.
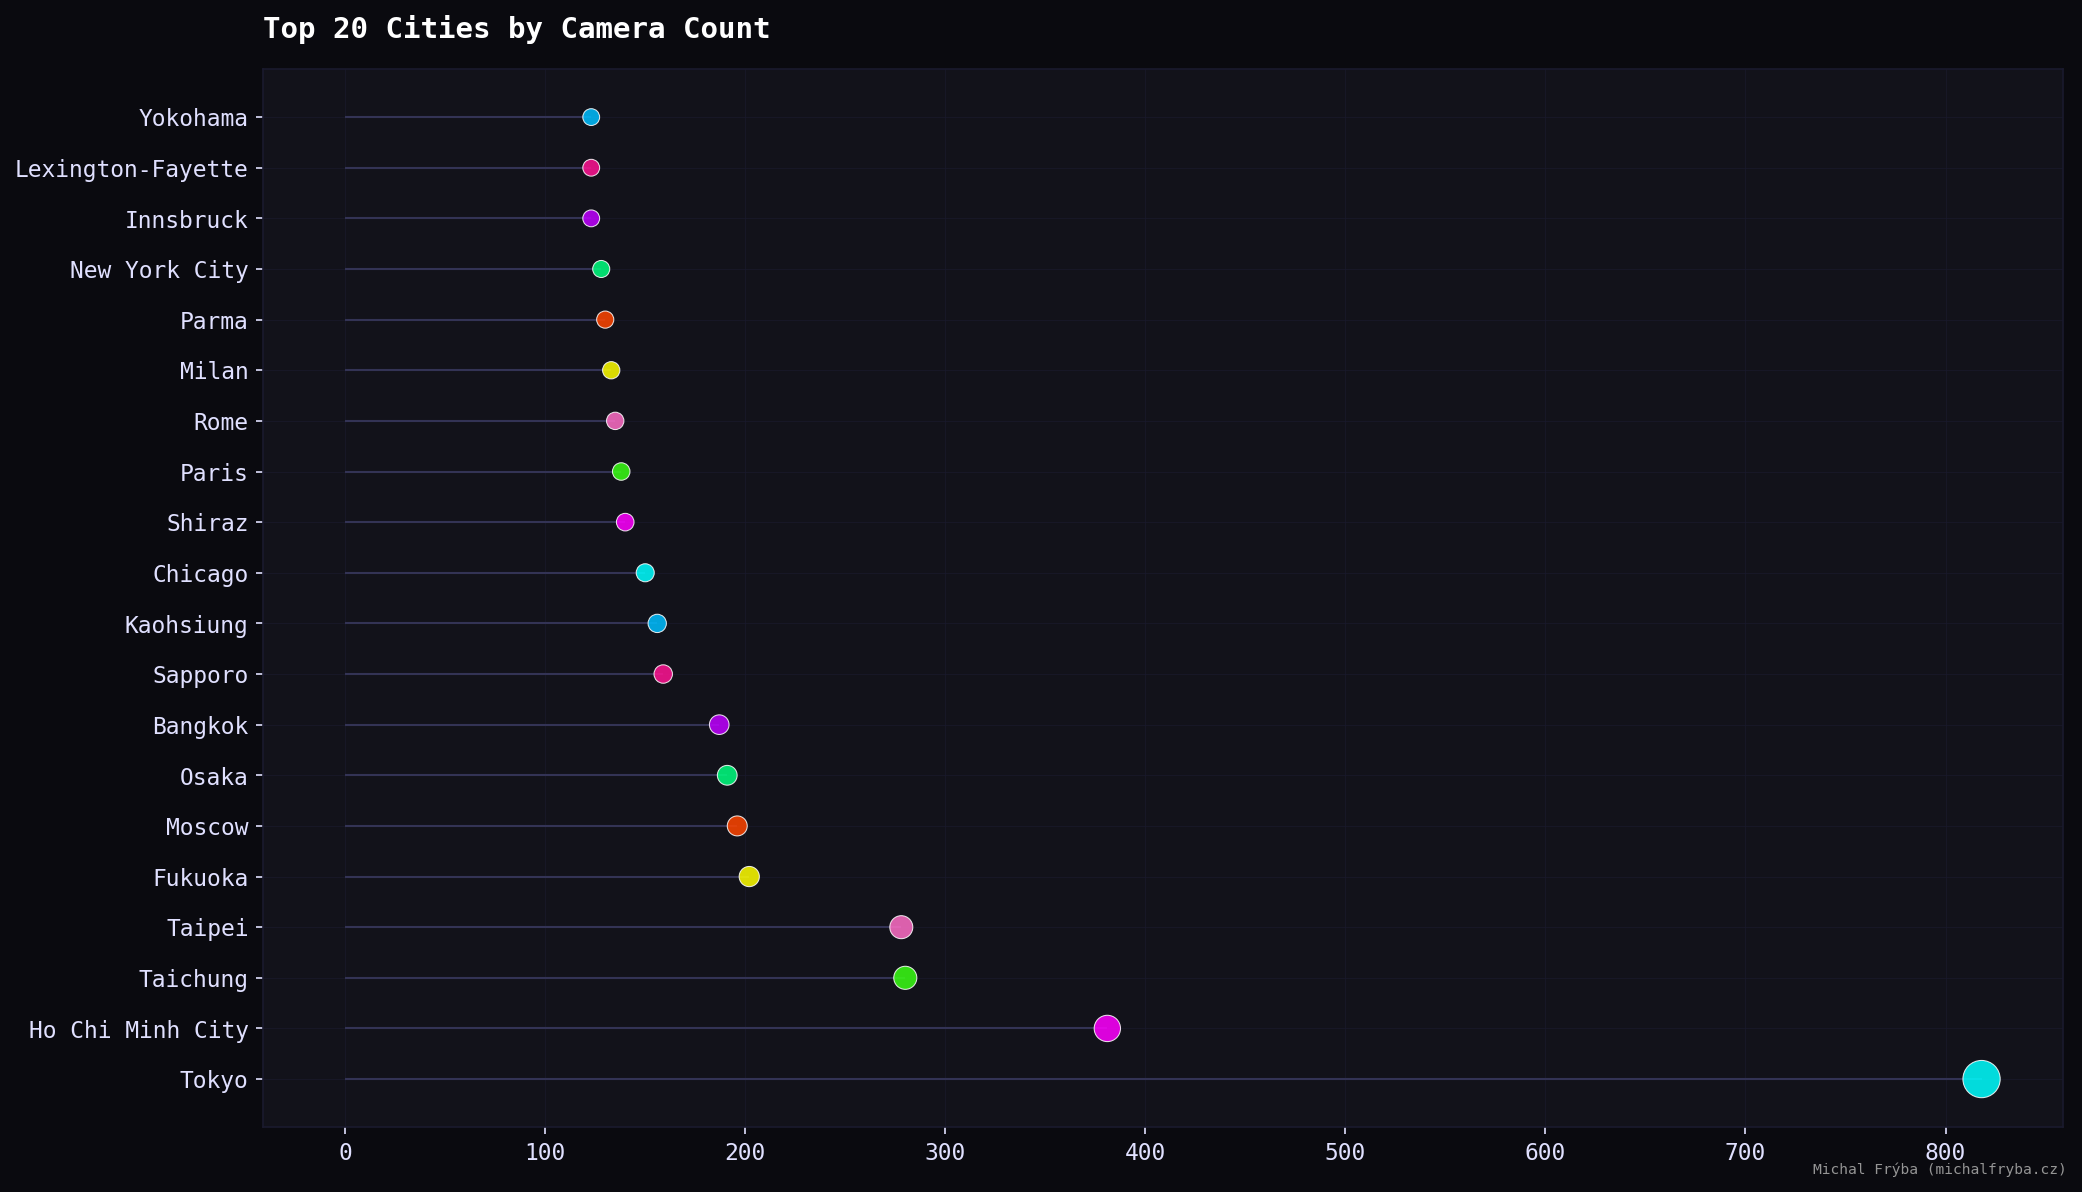
At the city level, Tokyo stands out by a large margin, followed by Ho Chi Minh City, Taichung, and Taipei. Several Japanese cities also appear, indicating higher camera density. European and US cities such as Paris, Rome, Milan, New York City, and Chicago appear with smaller counts. Large cities naturally mean more cameras and occasionally more things unintentionally shared with the internet.
Scene Insights
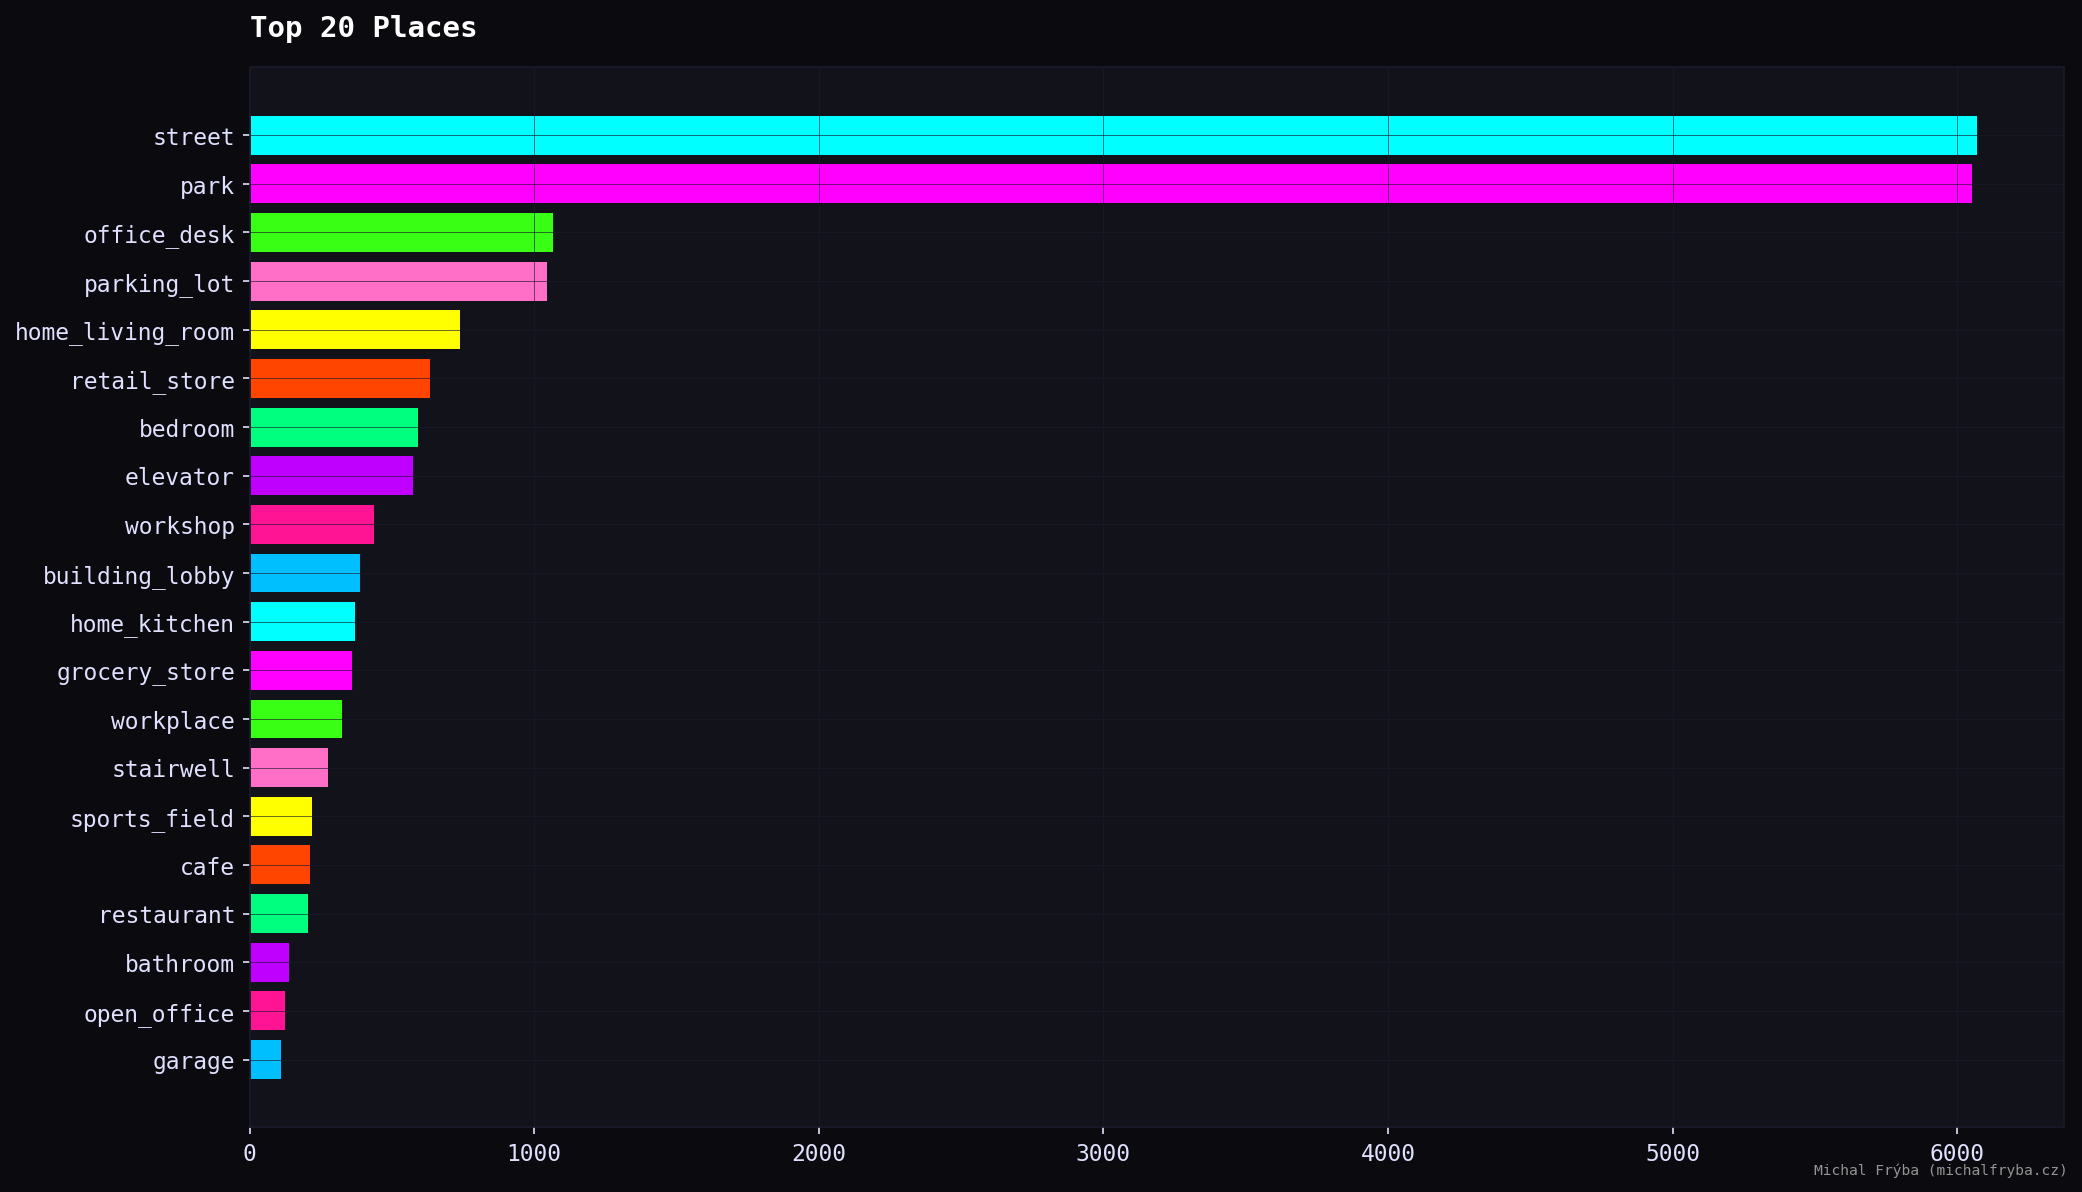
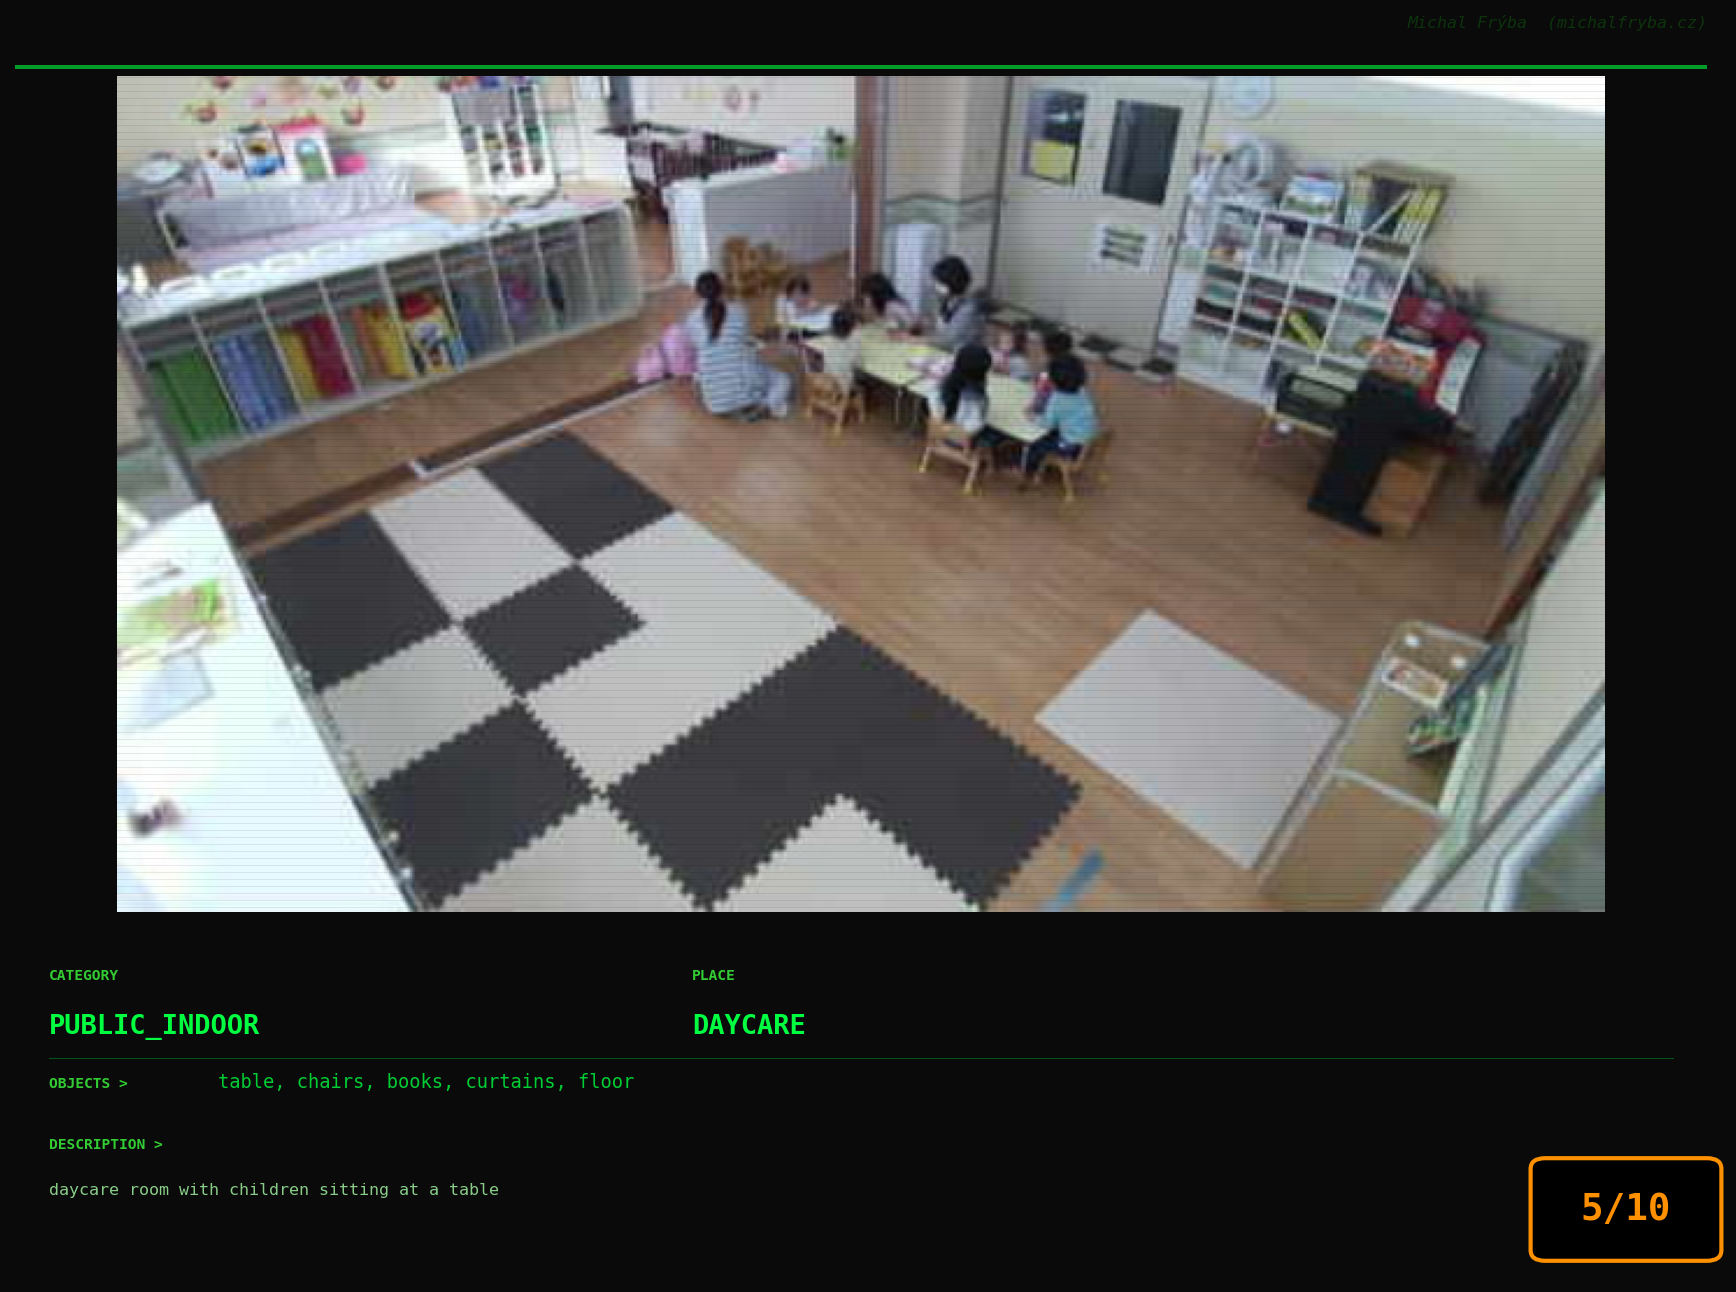
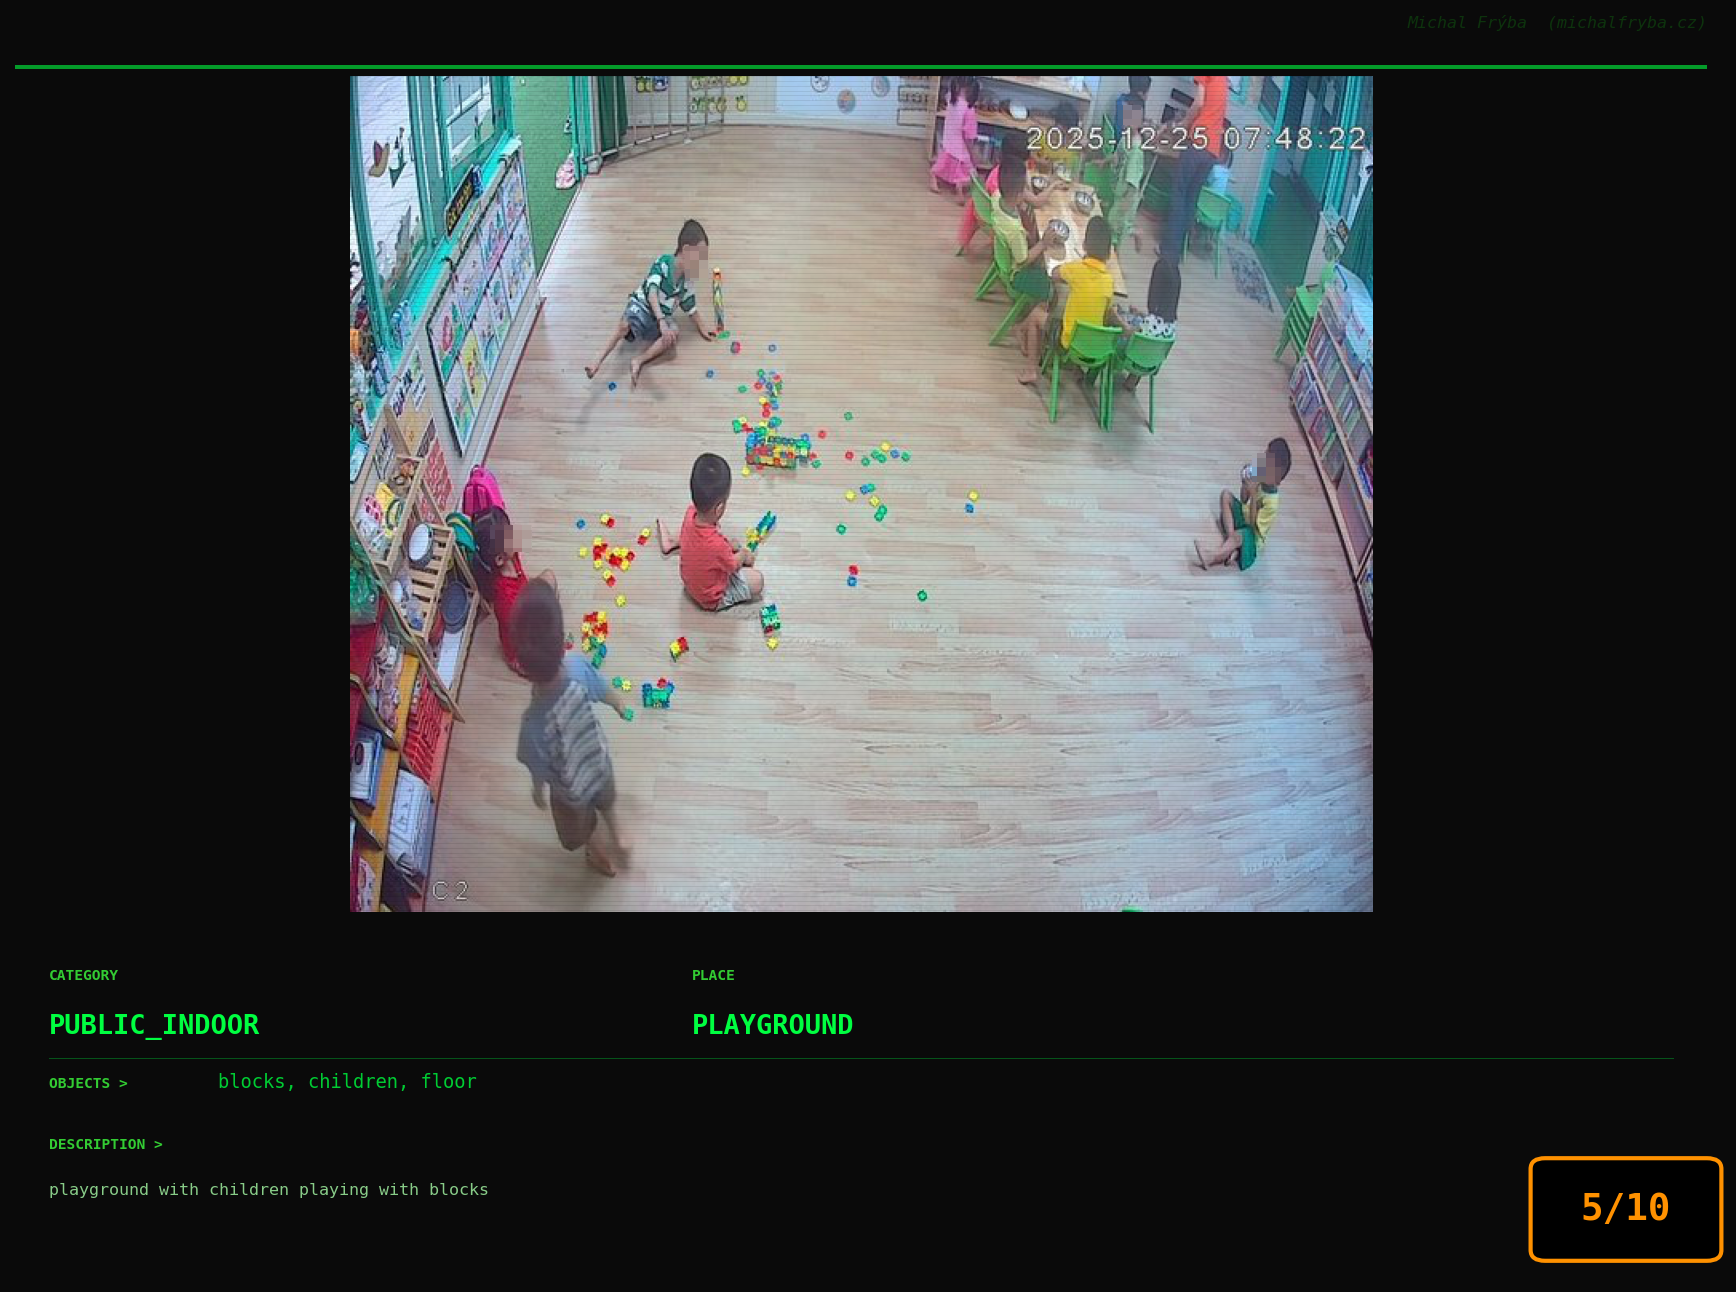
The most common camera locations are streets and parks, which explains why the majority of cameras fall into the lower privacy risk categories. These environments are typically public and expected to be monitored. However, the dataset also includes office desks, parking lots, living rooms, retail stores, and bedrooms, which quickly shifts the conversation from public infrastructure to potential privacy concerns. Notably, the presence of home environments (living rooms, bedrooms, kitchens) suggests that some cameras may not have been intended for public access at all.
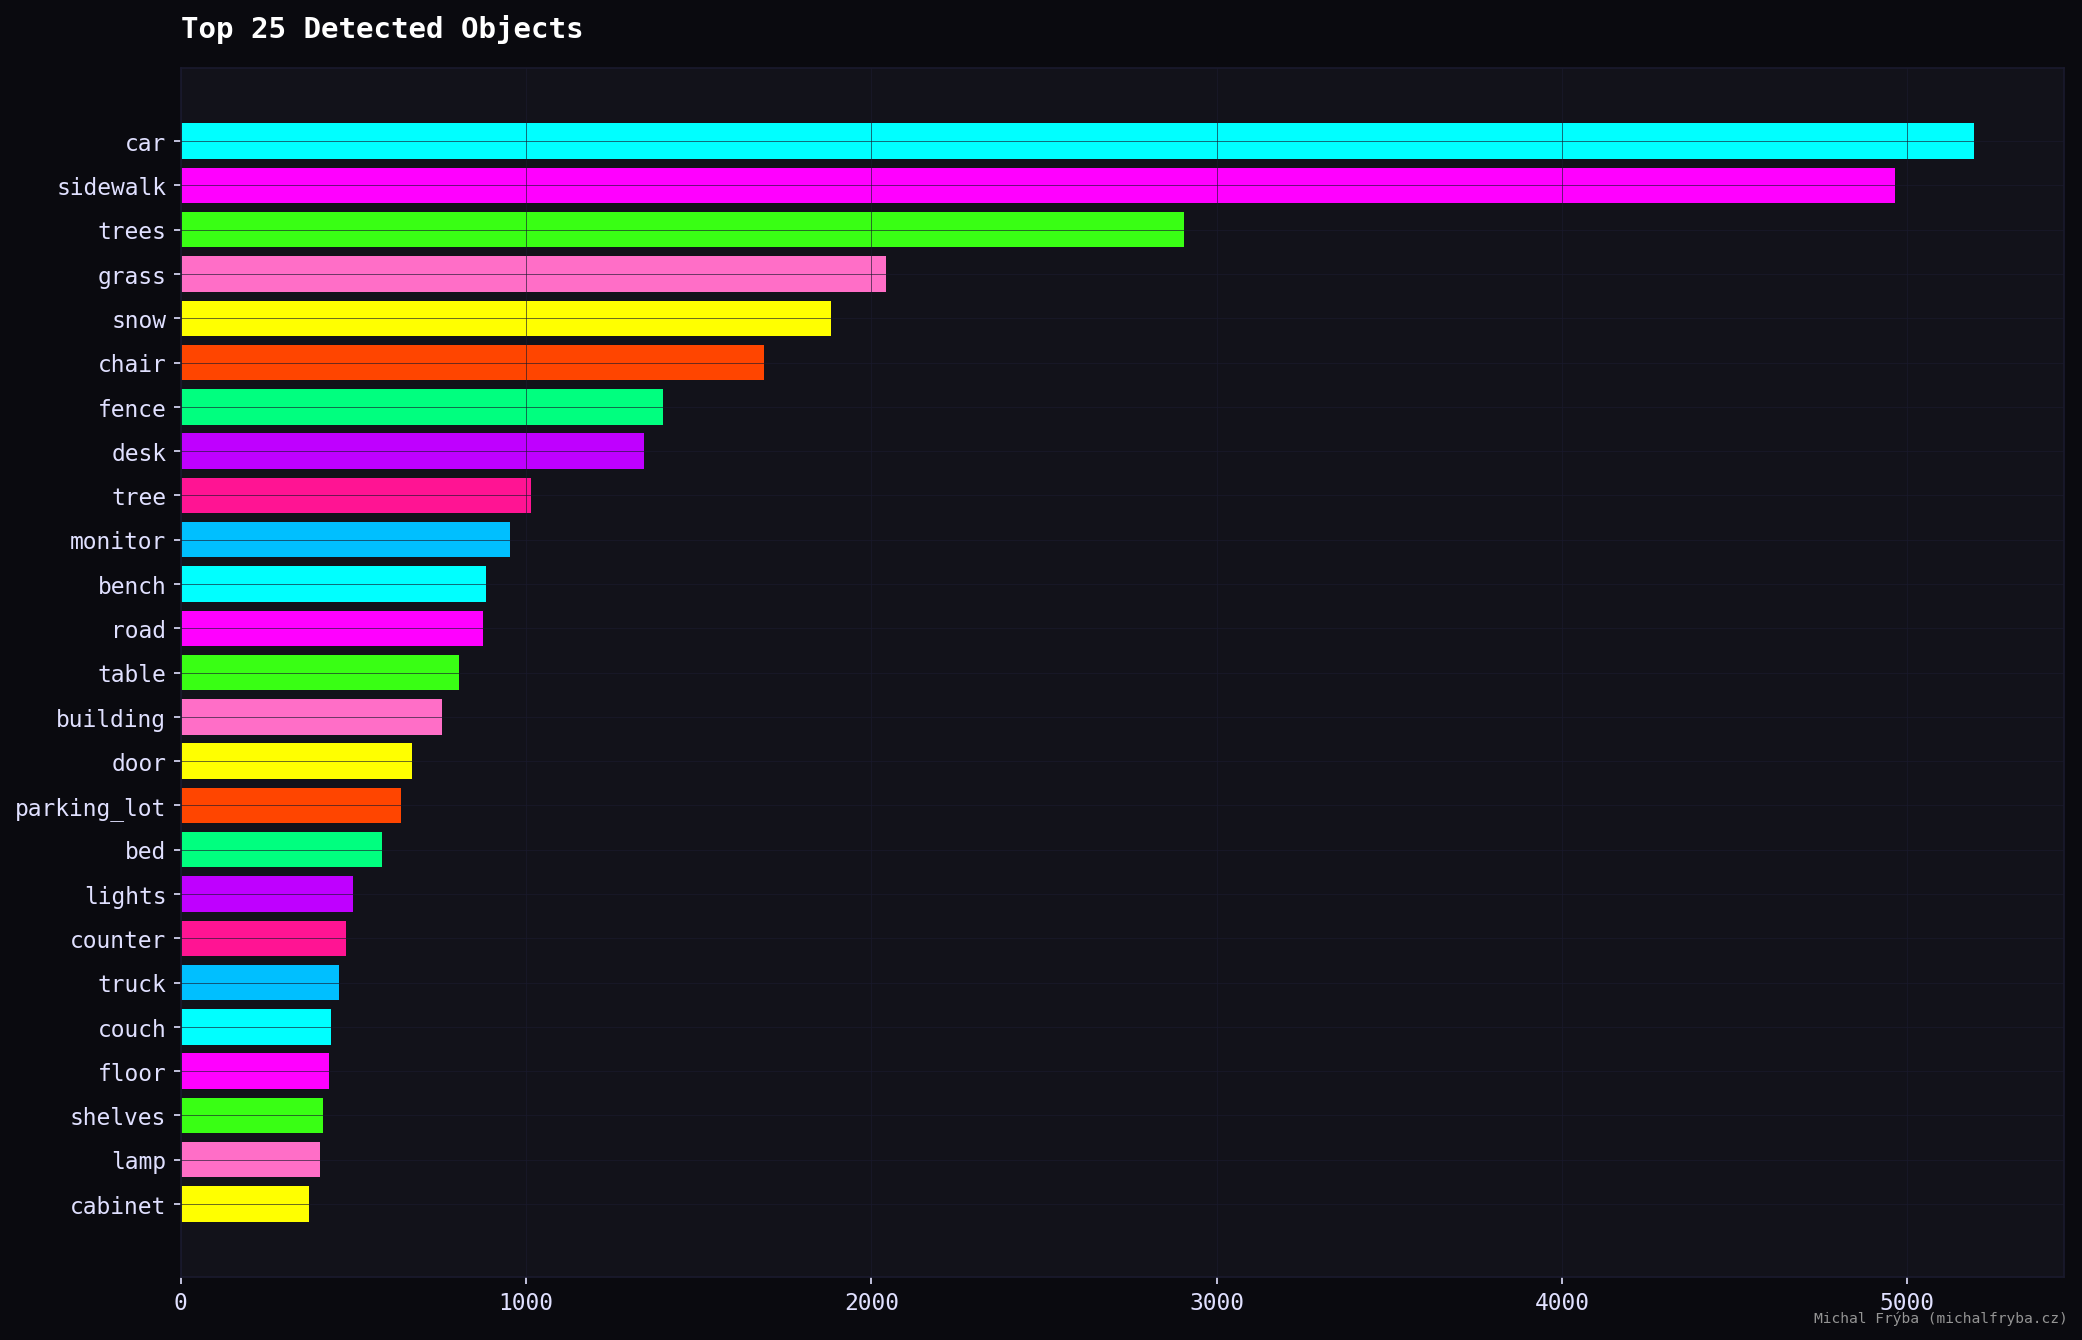
Across all images, the AI detected 50241 objects with 137 unique types. Object detection further confirms the dominance of outdoor scenes, with cars, sidewalks, trees, and grass leading the results. These are typical for street and park cameras.
However, indoor-related objects also appear frequently, including chairs, desks, monitors, beds, counters, and shelves. These objects indicate indoor environments such as offices, homes, and retail spaces, which generally carry higher privacy implications.
The presence of monitors, desks, and counters is particularly interesting, as these often correspond to workspaces or operational areas.
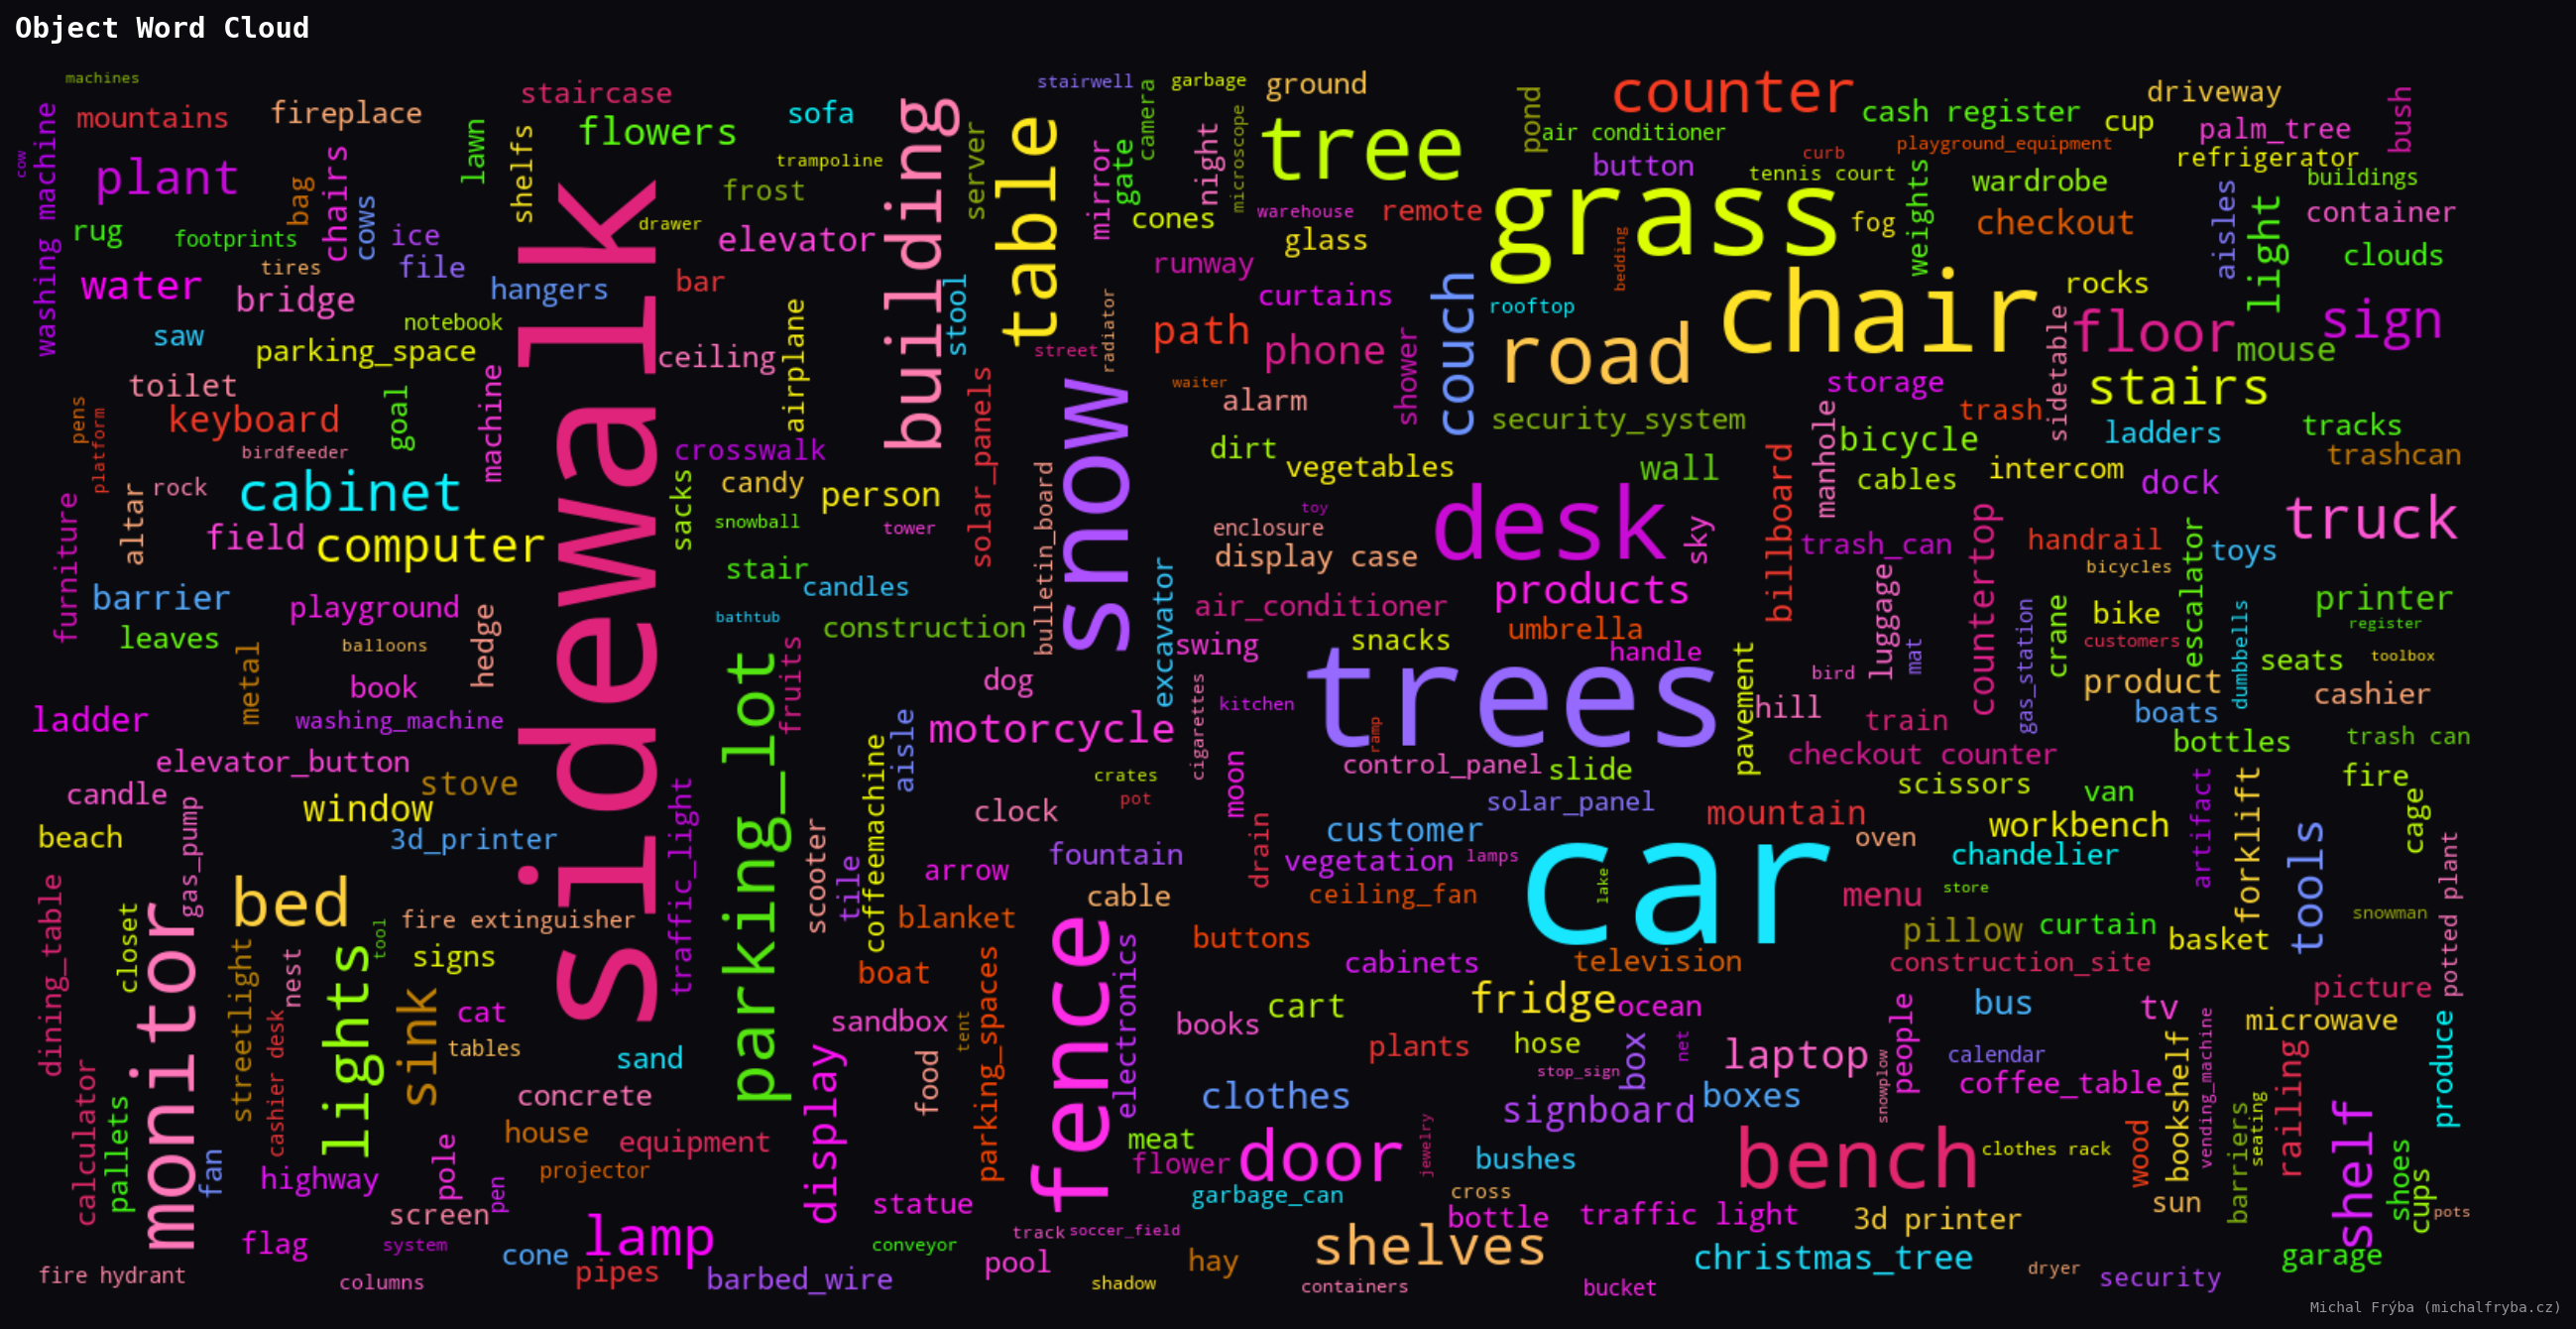
The word clouds below show object frequency (larger words mean more occurrences. This provides a quick overview of what publicly accessible cameras are actually capturing).
Another useful source for understanding what cameras capture is the AI-generated scene descriptions. After removing common stopwords (like “a”, “the”, “with”, “and”, etc.), I generated another word cloud from these descriptions.
Here the AI gets noticeably more creative (about 1800 unique words, 84800 in total). Since descriptions combine objects, places, and context, the vocabulary becomes much richer. Same cameras, just with a bit more storytelling.
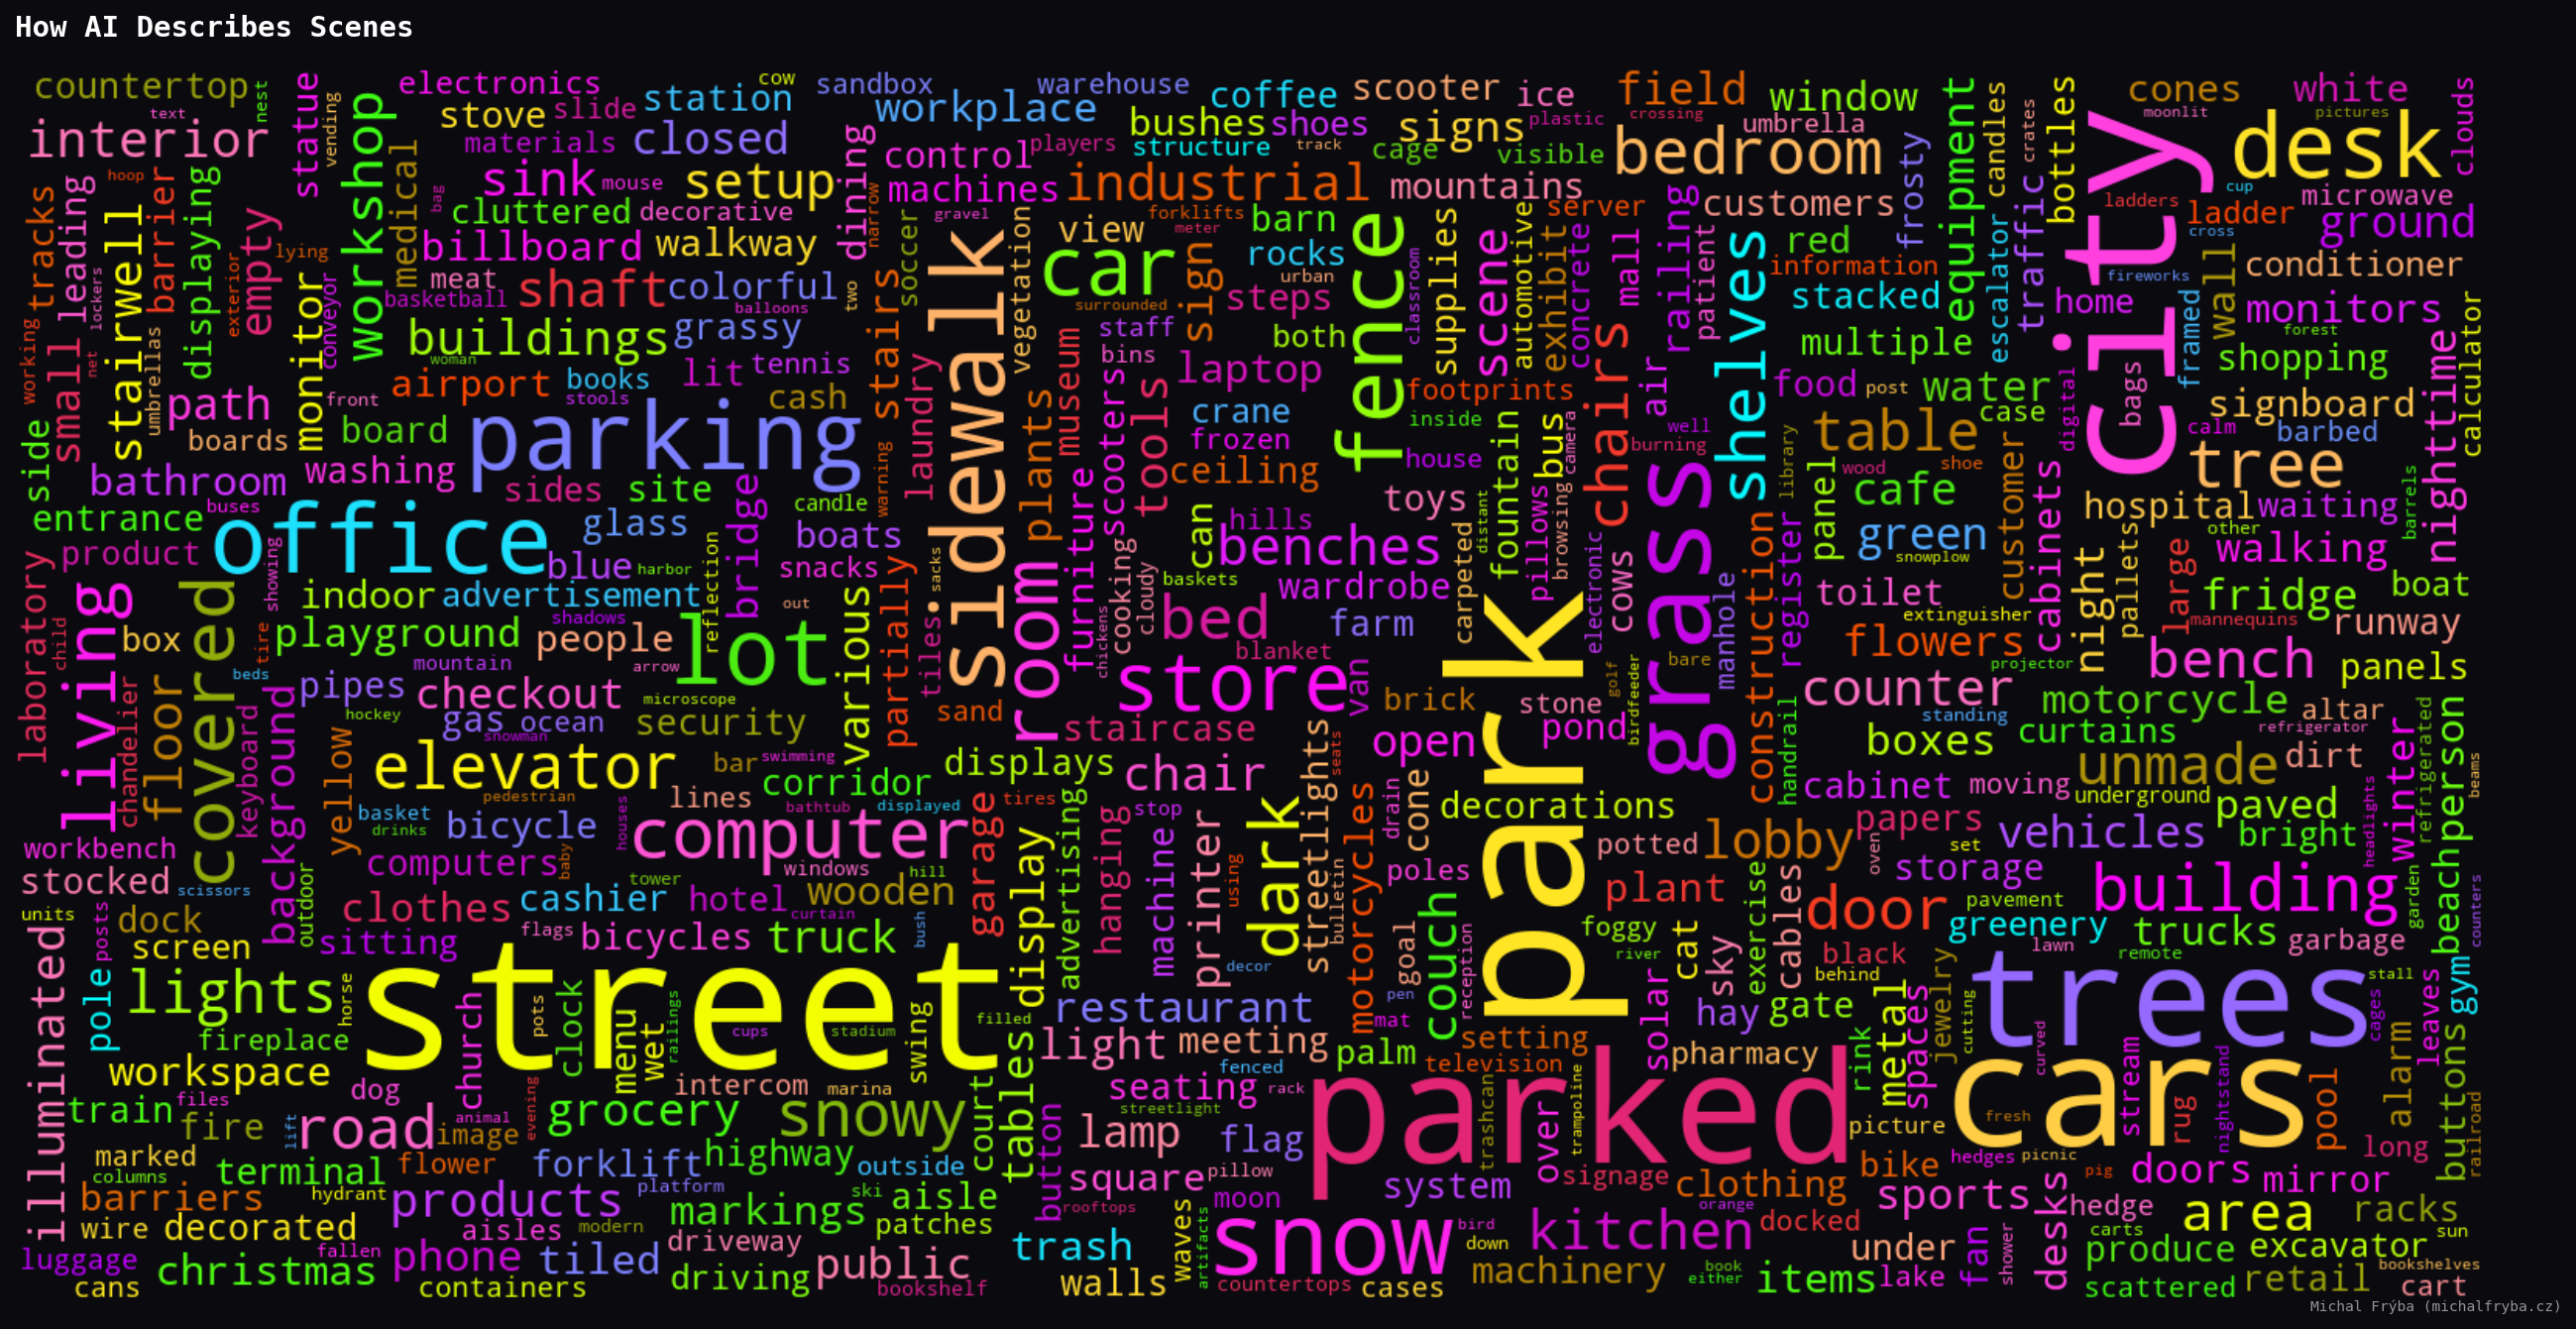
Among the rarest words, things got surprisingly weird. The AI occasionally mentioned pirate, cowboy, comet, octopus, shark, hedgehog, ducks, and bears … which sounds less like security cameras and more like a very confused nature documentary. Some words were unexpectedly dramatic, like bloodstains, surgery, guns, checkpoint, police, syringe, cemetery, gravestones … words that definitely make you pause and wonder what exactly the camera saw. One wonders whether the AI caught something unusual… or just got a little too creative.
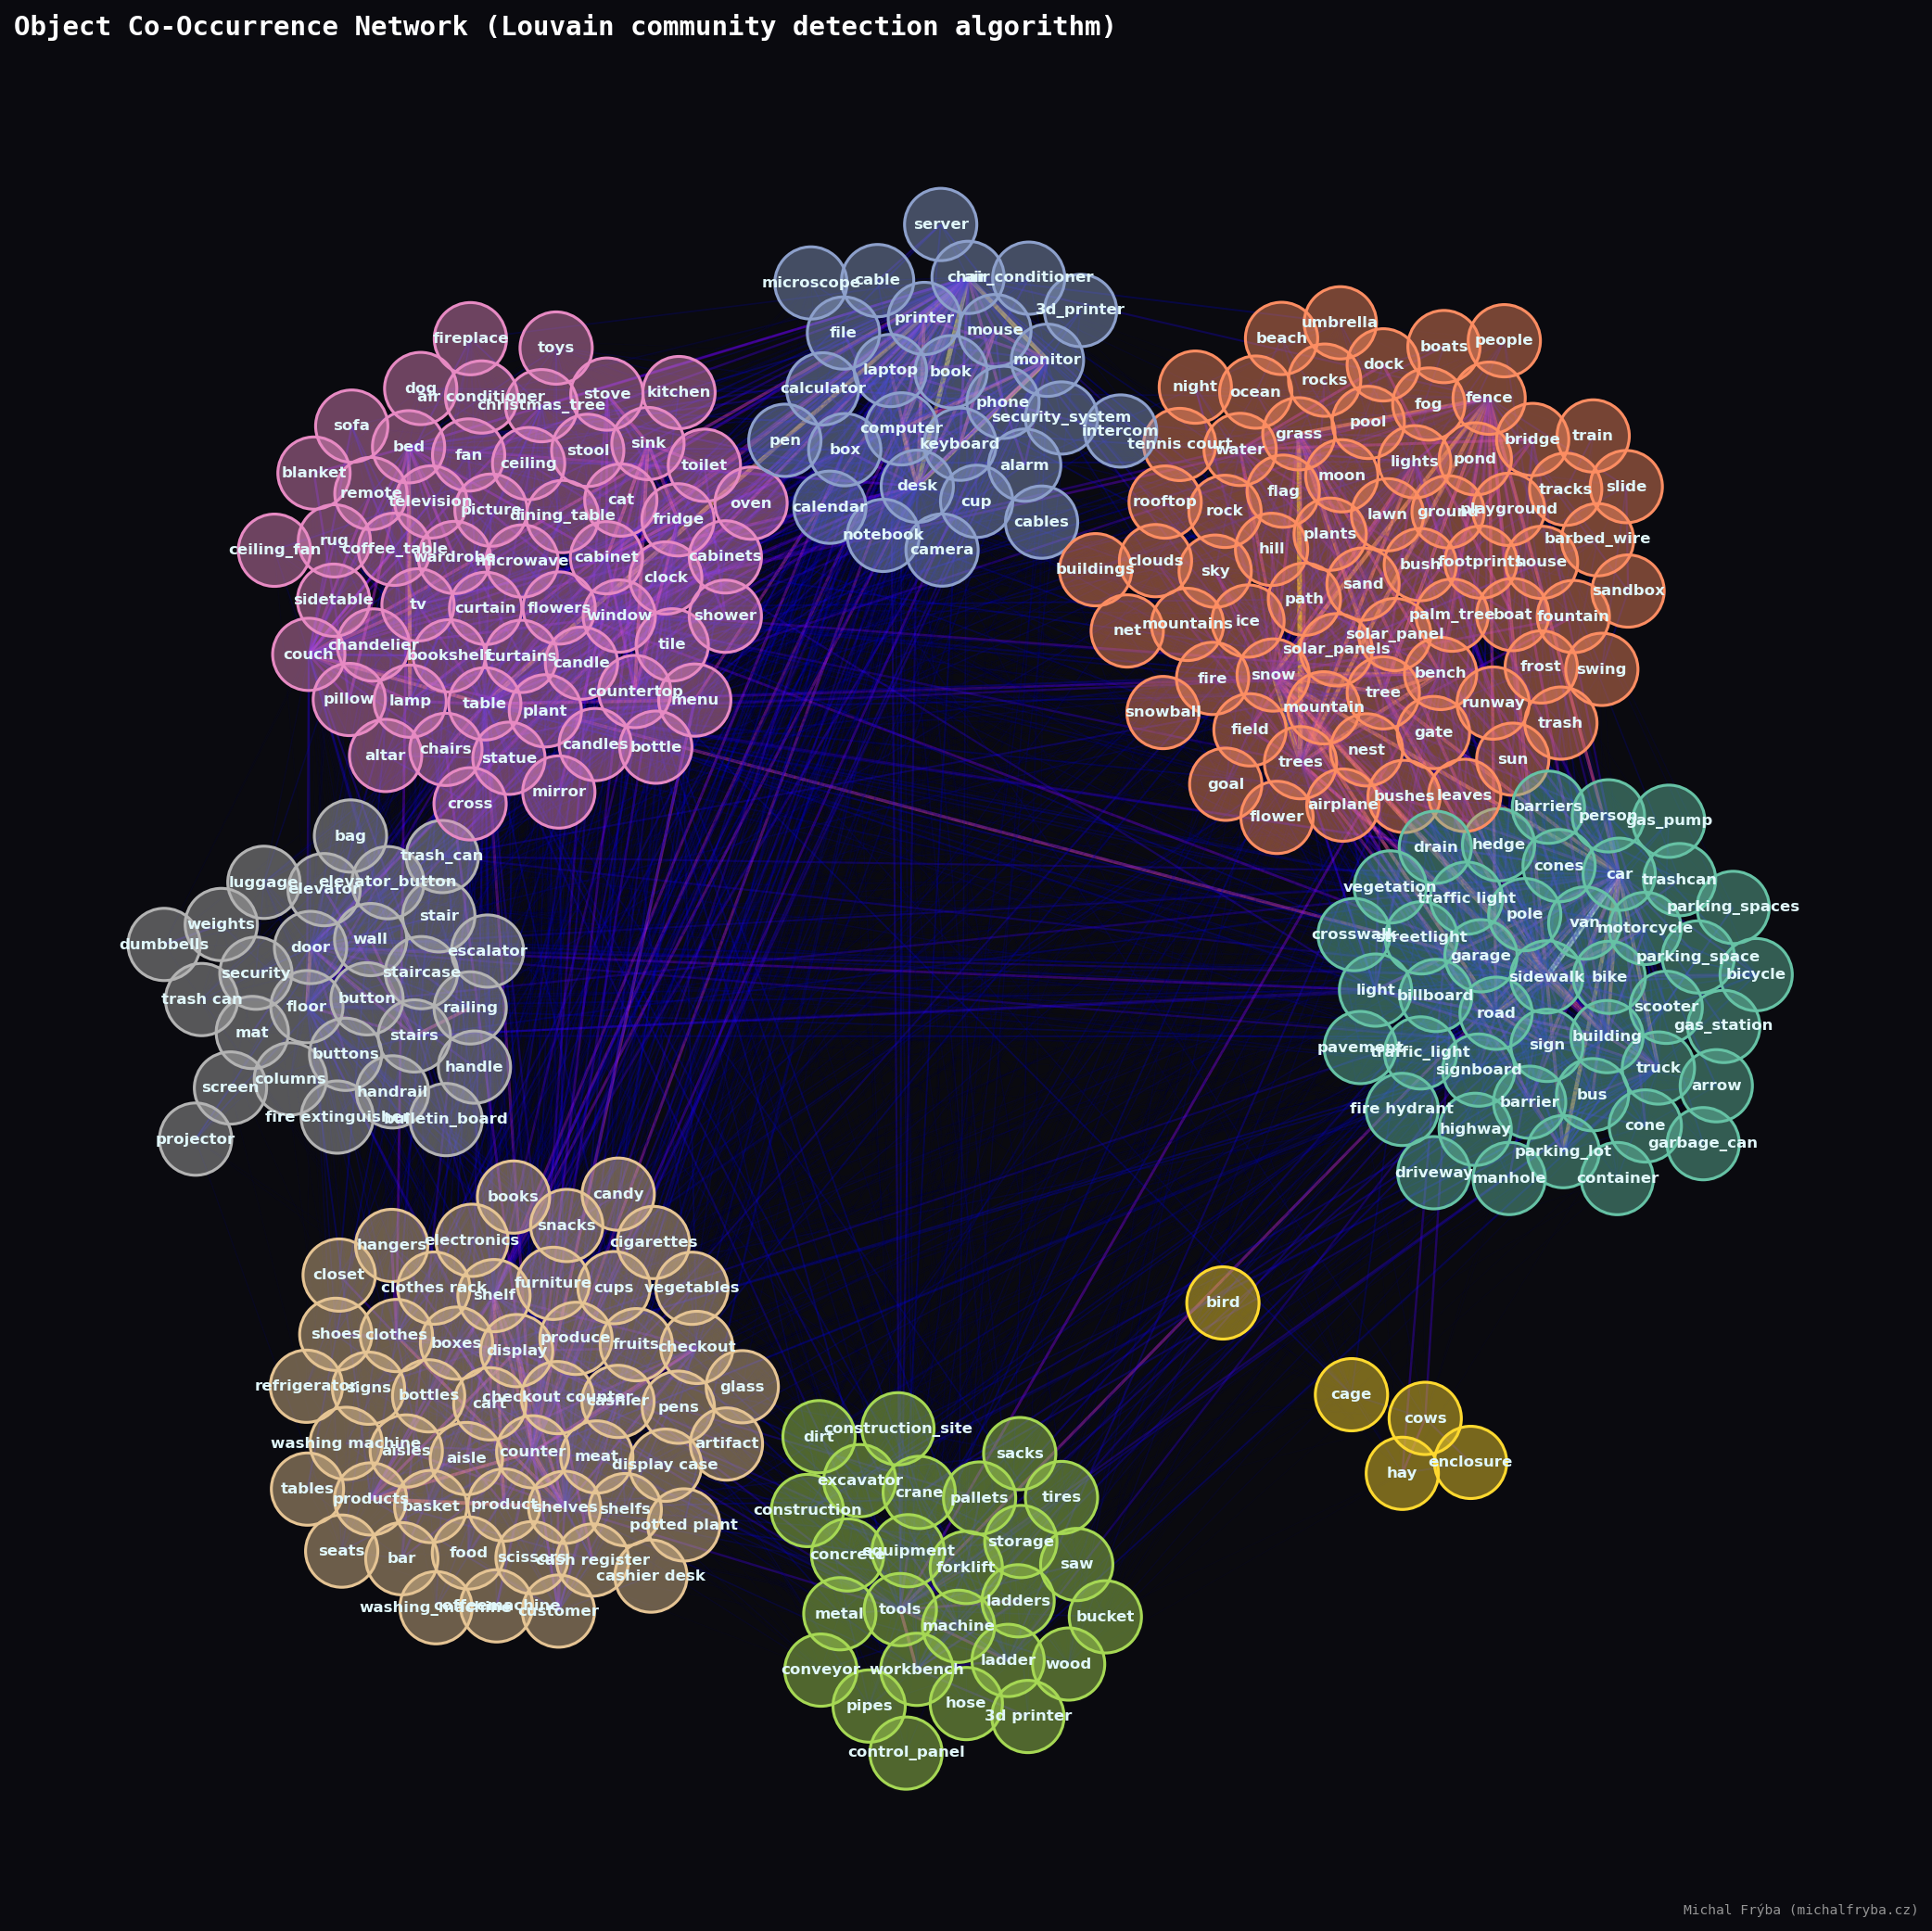
To better understand scene context, I also analyzed which objects appear together in images. This network graph shows relationships between objects where the more visible connections, the more frequently they co-occur. Unsurprisingly, common outdoor elements like road, building, tree, car, and sidewalk form the “central cluster”, appearing together across many cameras.
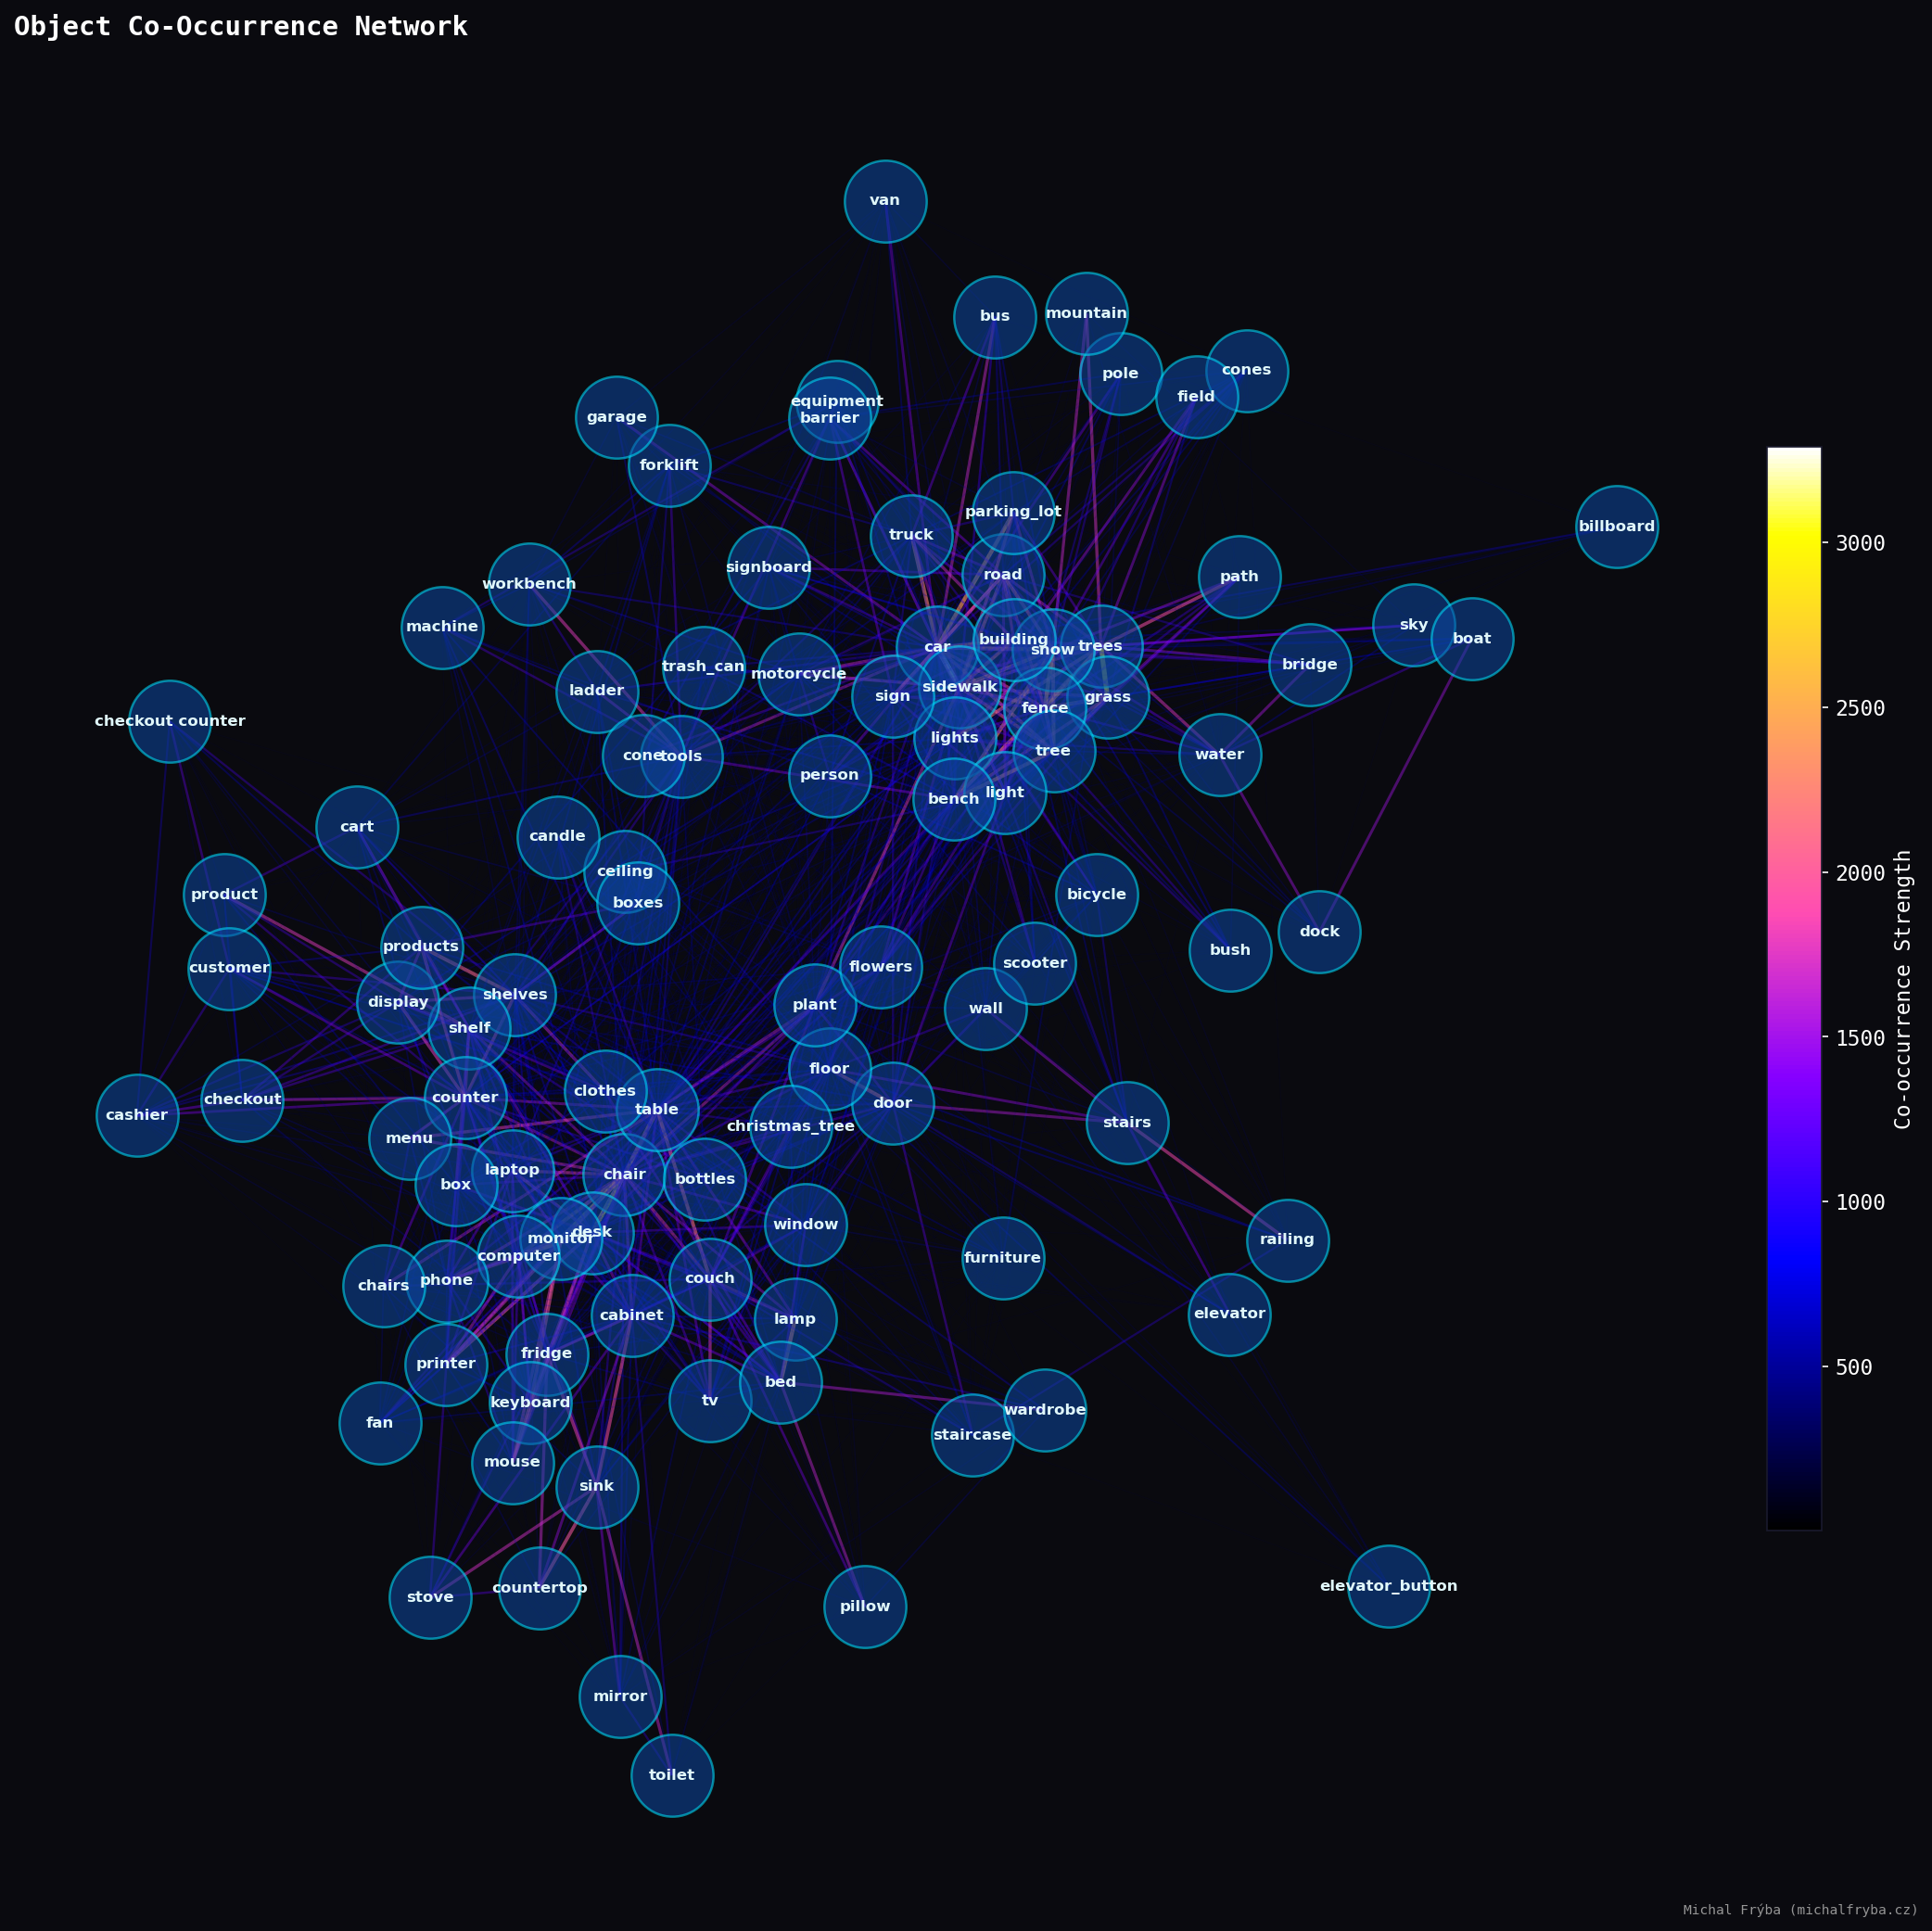
Well, the previous graph isn’t exactly ideal, and it’s a bit of a mess. So to uncover natural groupings, I applied the Louvain community detection algorithm to the object co-occurrence network. In simple terms, it groups objects that appear together more often than expected. Or in other words letting the data decide what belongs with what, instead of me guessing.
The algorithm mentioned above also allowed me to use more objects without the bubbles overlapping, and I didn’t have to struggle with fine-tuning the ideal “attraction force” between individual objects. Using the top 300 most frequent objects, several clear communities emerged. One cluster groups indoor household items like furniture, appliances, and electronics. Another captures outdoor nature scenes with trees, sky, water, and terrain. A separate cluster represents urban street environments like cars, sidewalks, signs, and roads, while another groups industrial and construction equipment such as tools and machinery. A smaller cluster even isolates farm-related objects, because apparently some cameras are keeping an eye on cows too.
Also, the clusters aren’t perfectly separated, lots of connections exist between them. Which makes sense, because real life is messy. Sometimes you get a street next to a park next to construction equipment… and occasionally, probably a cow.
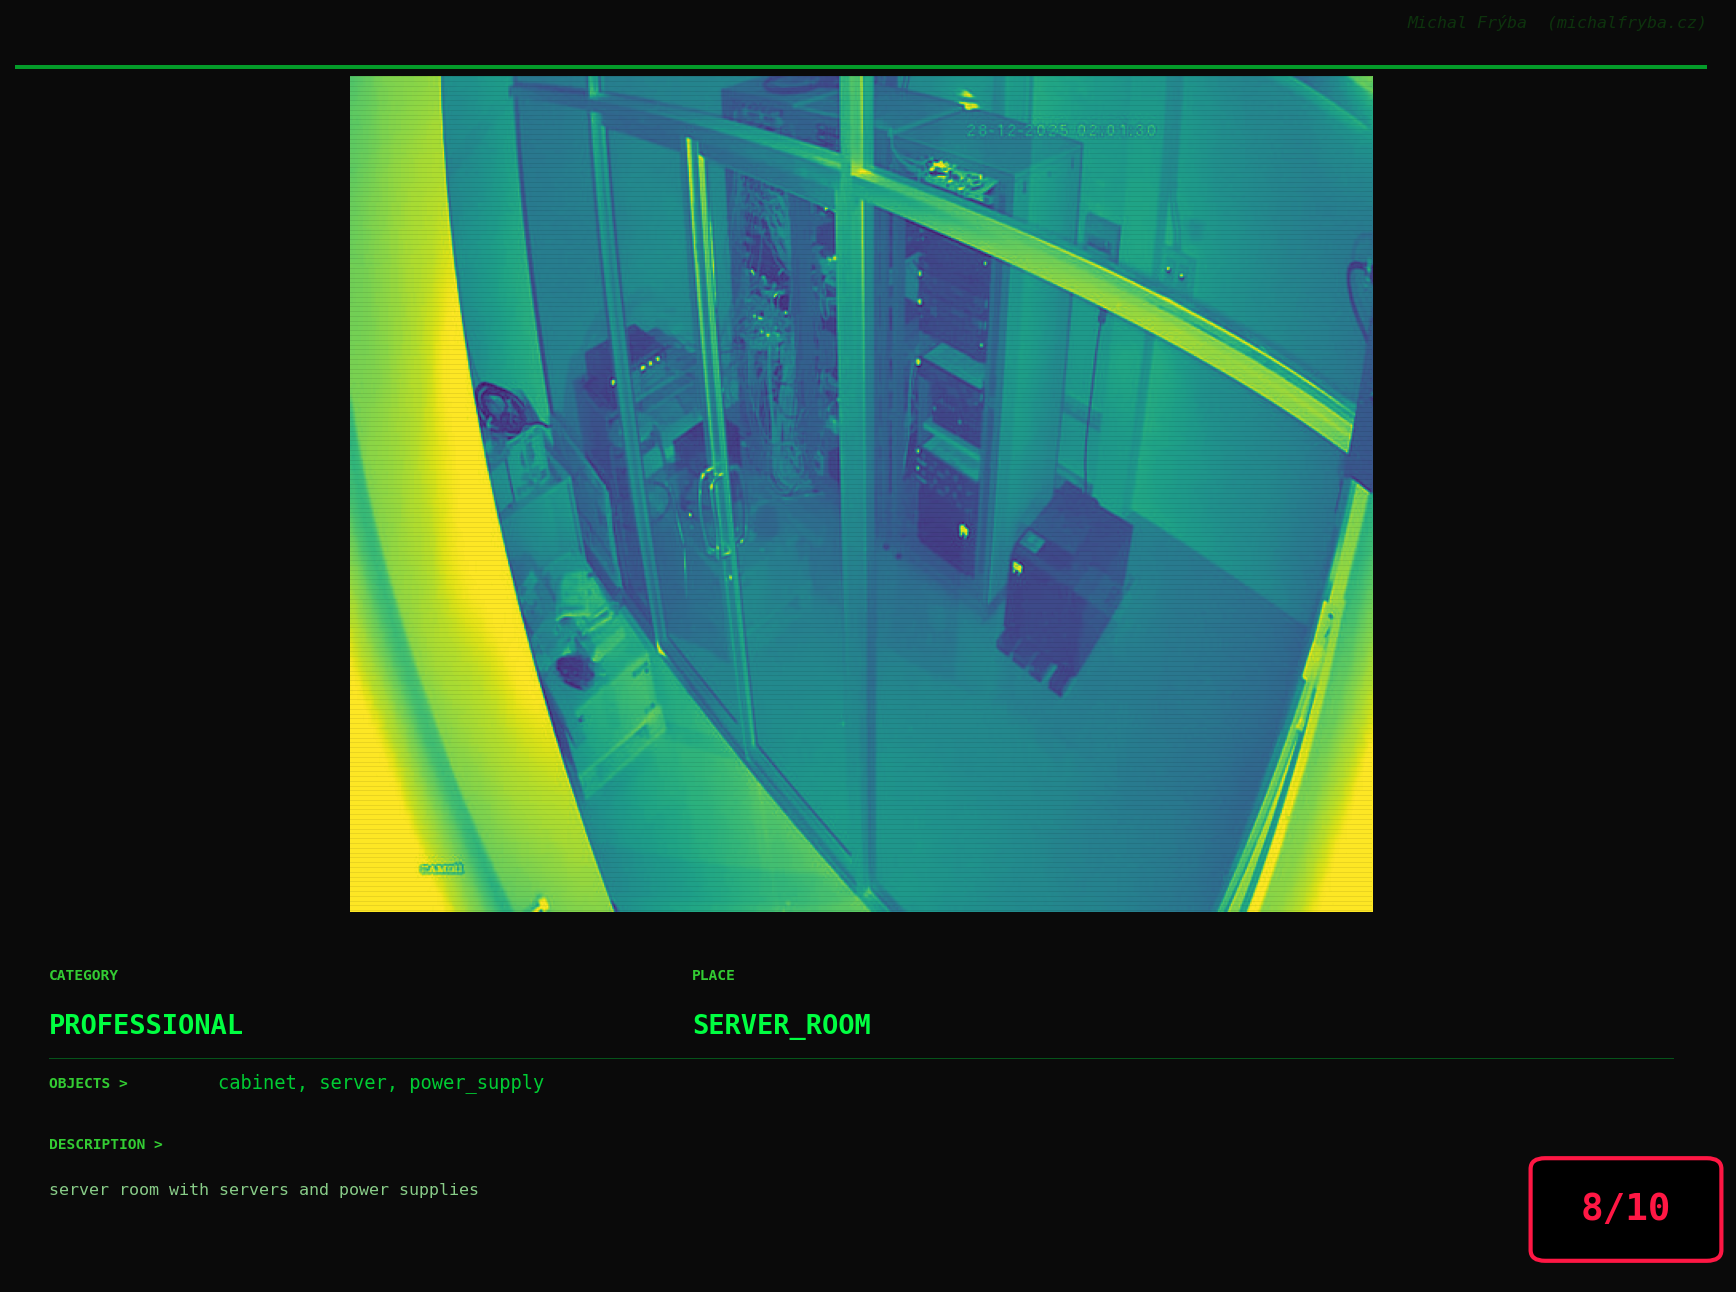
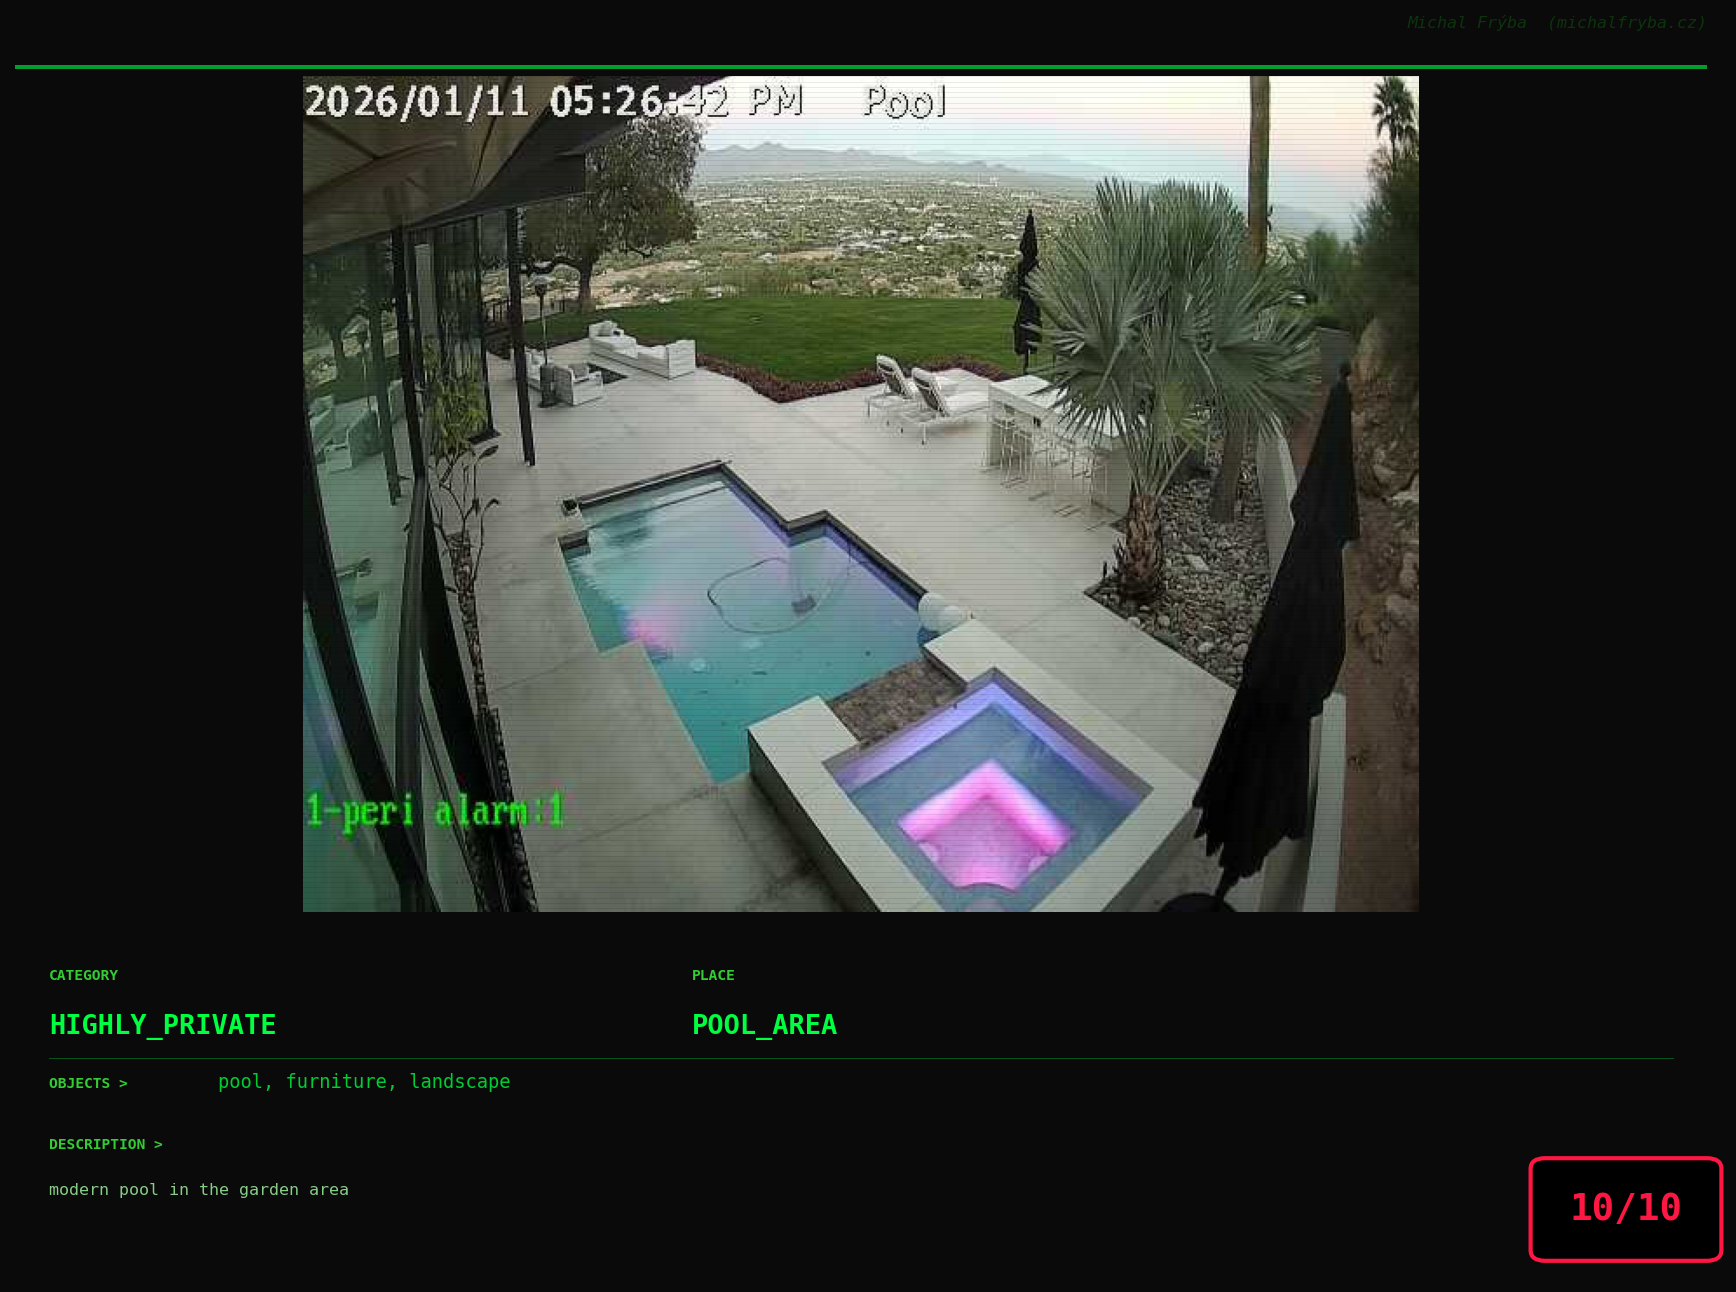
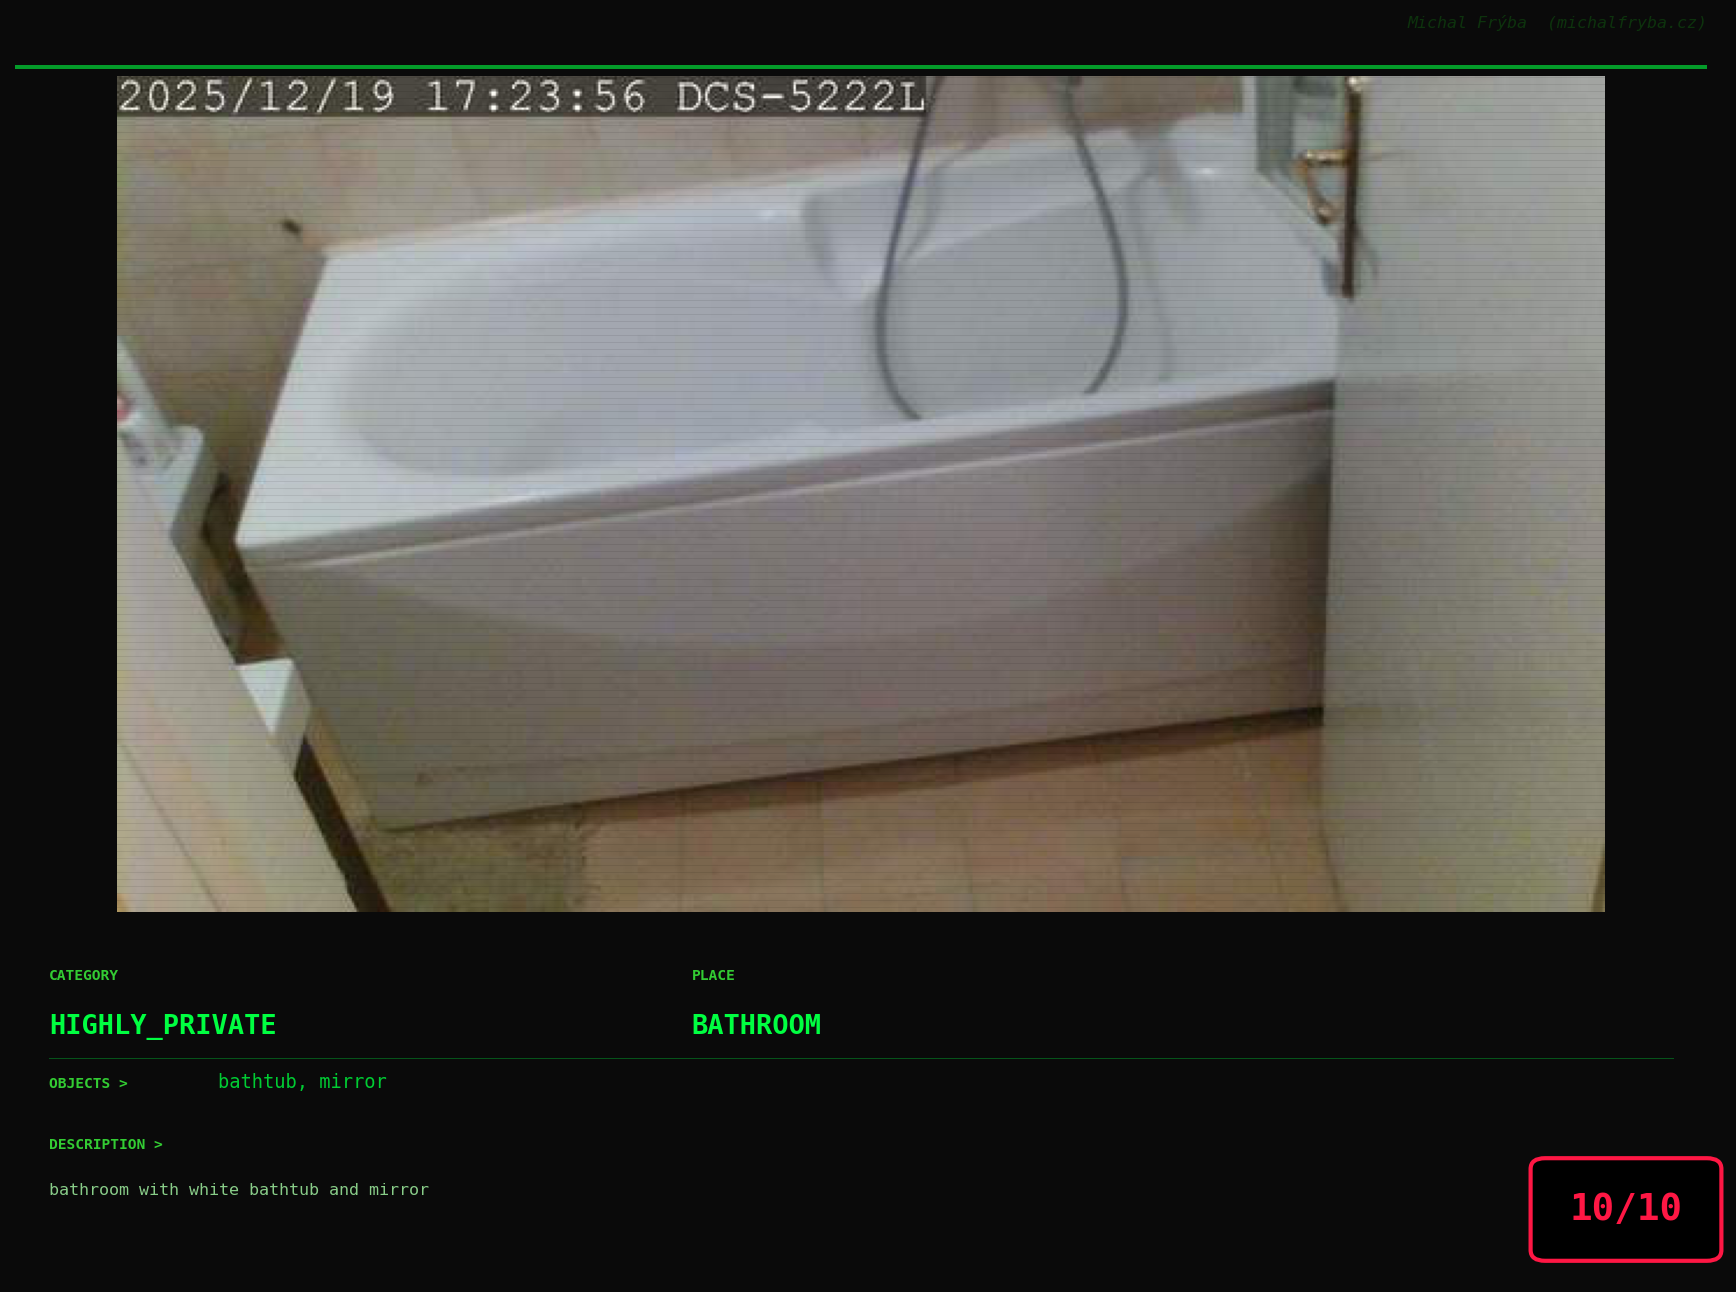
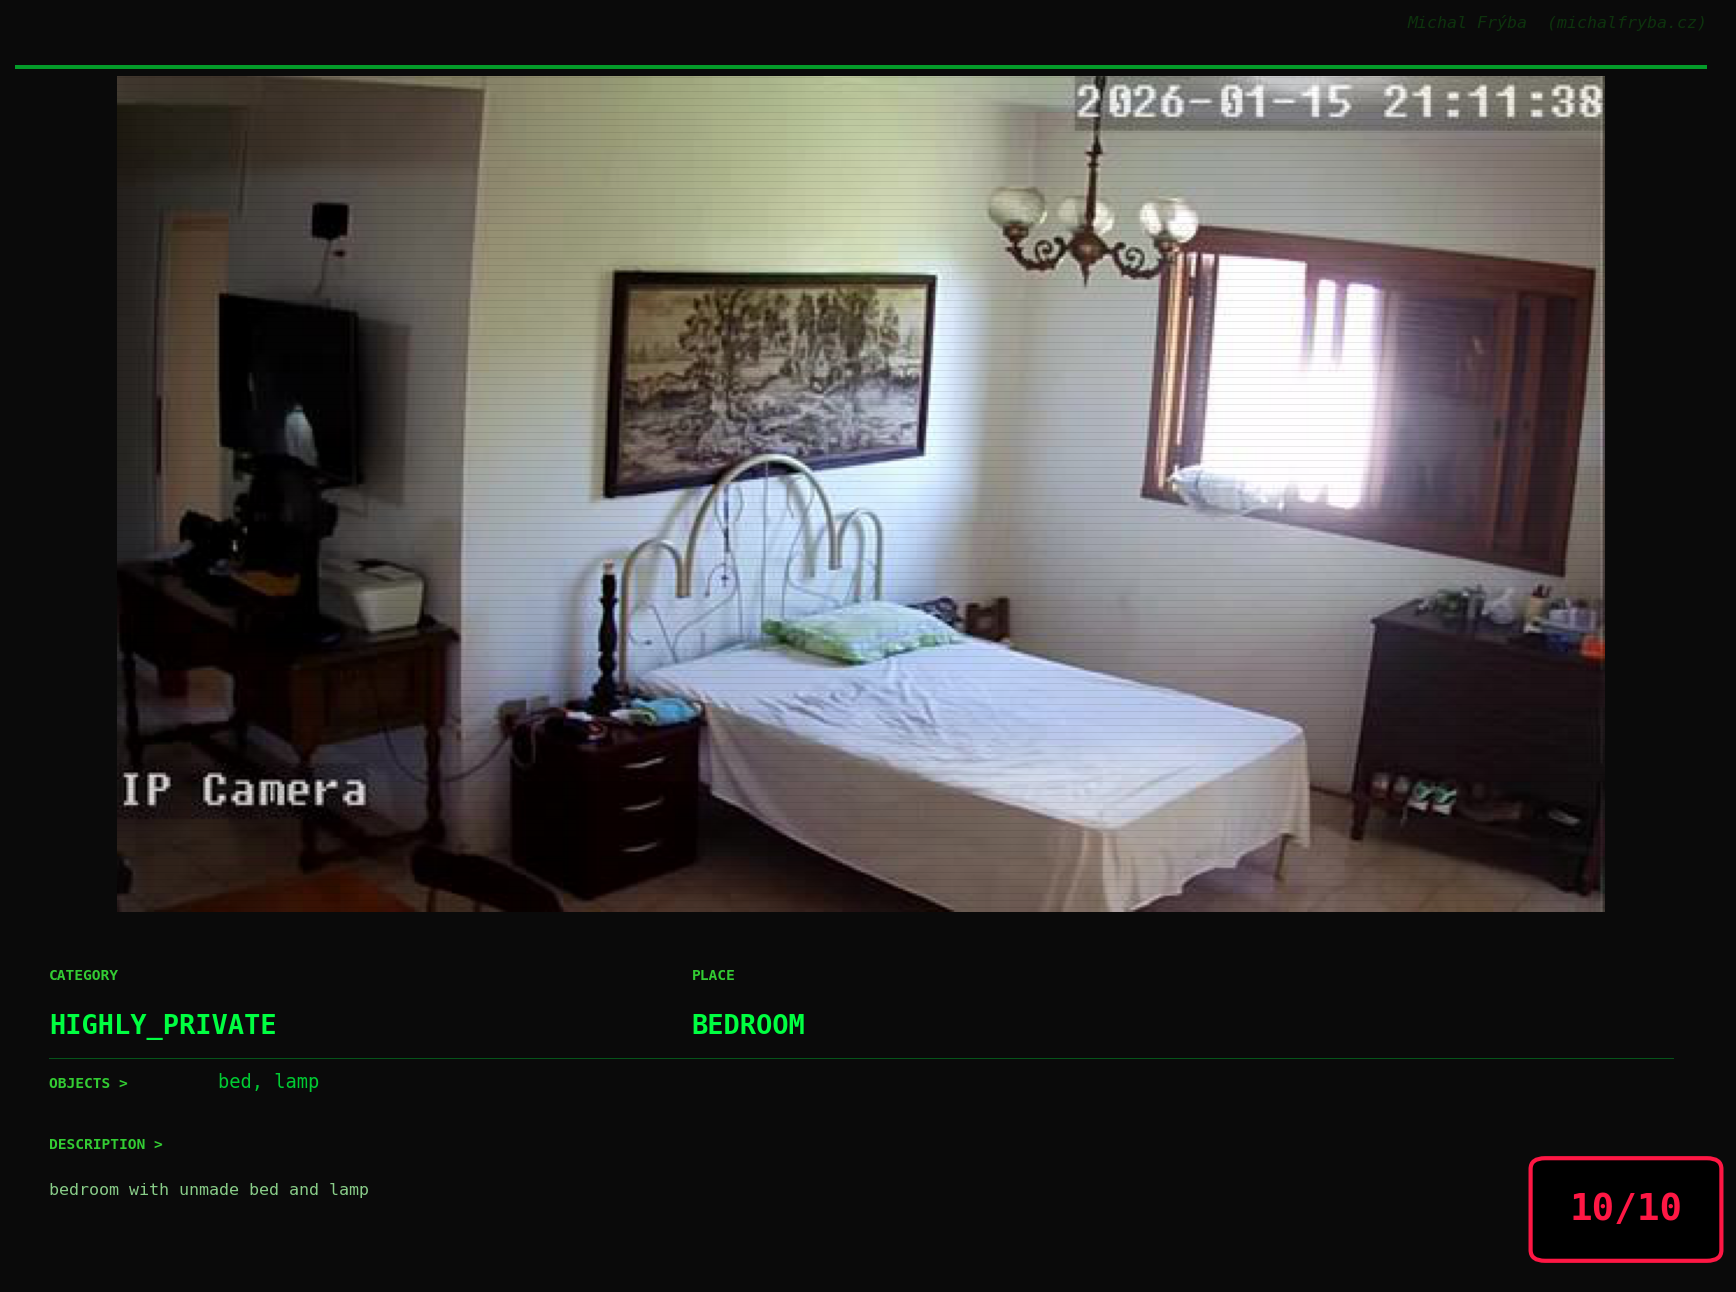
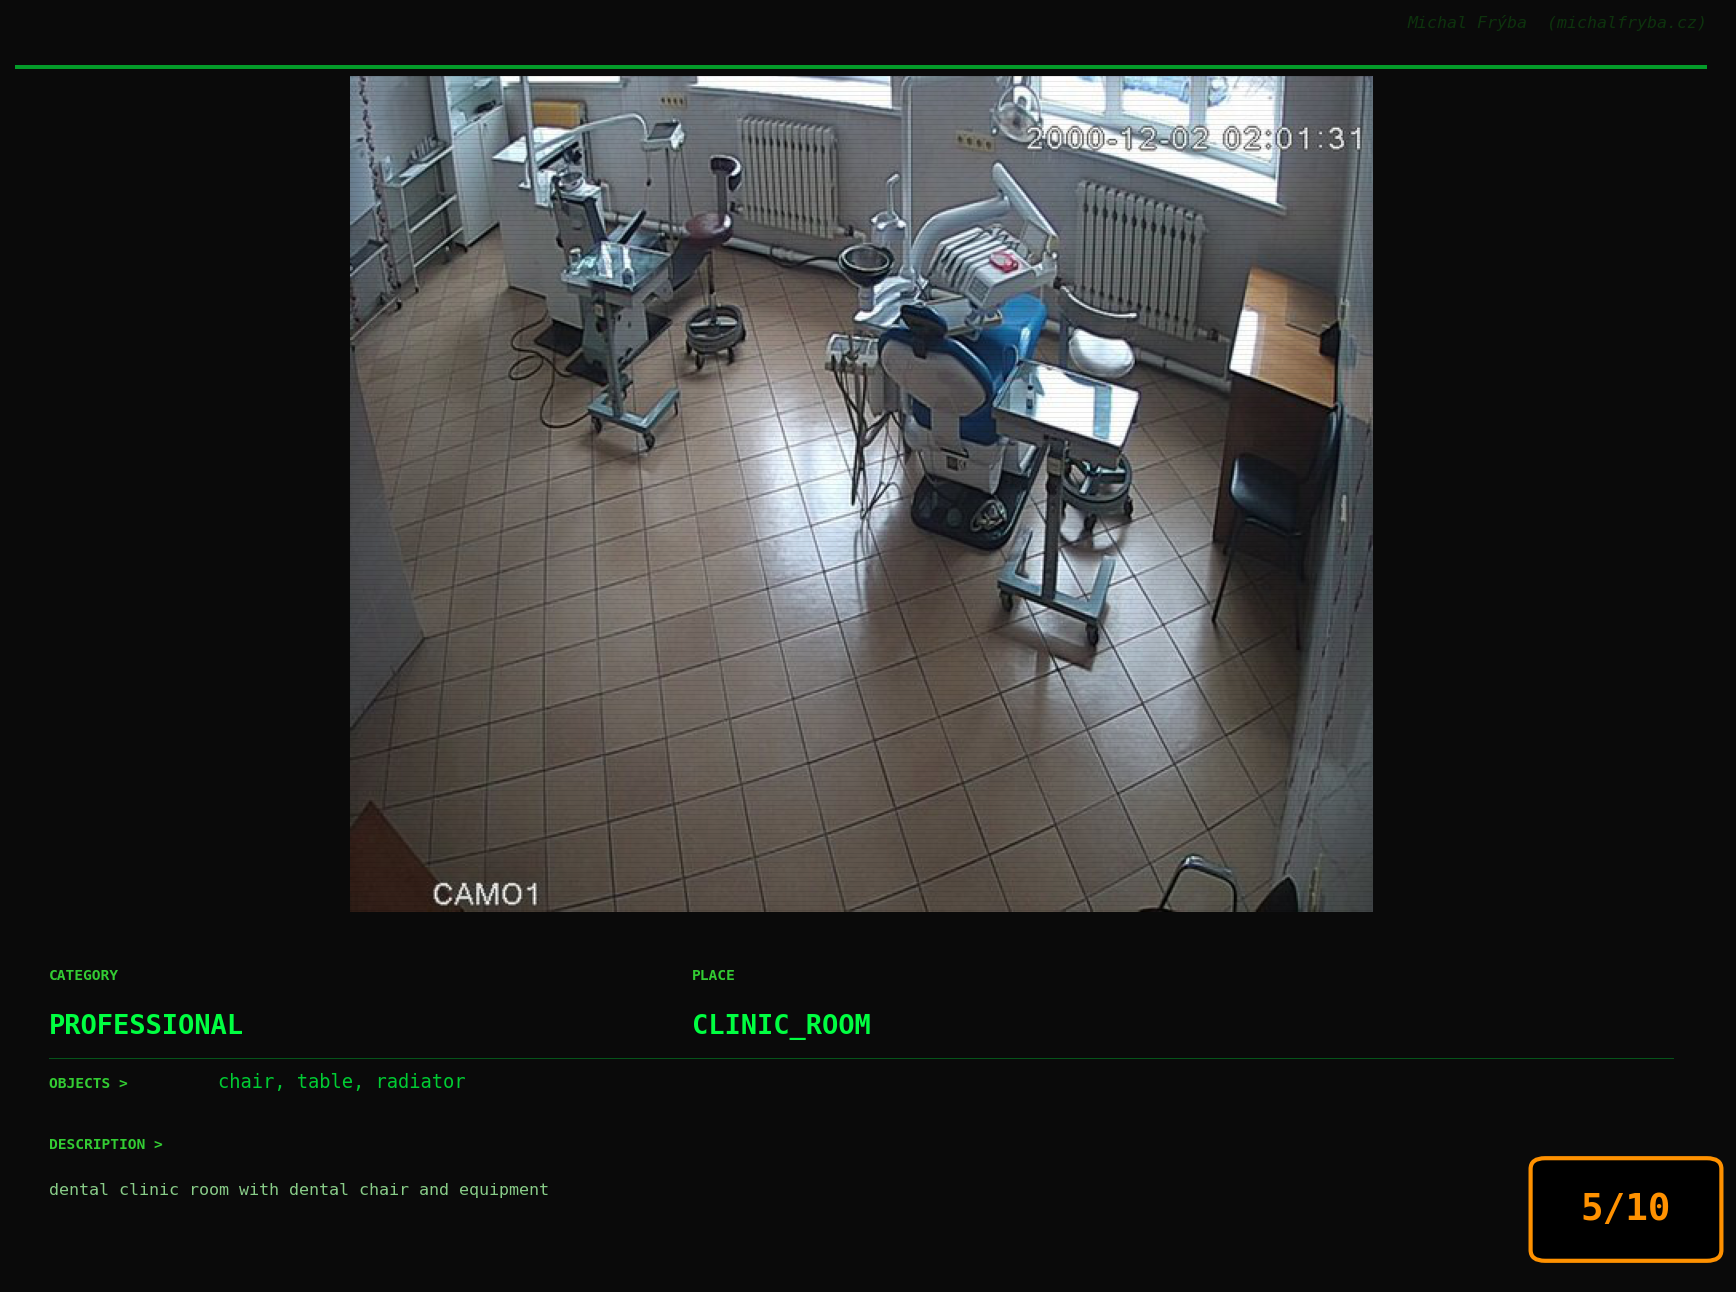
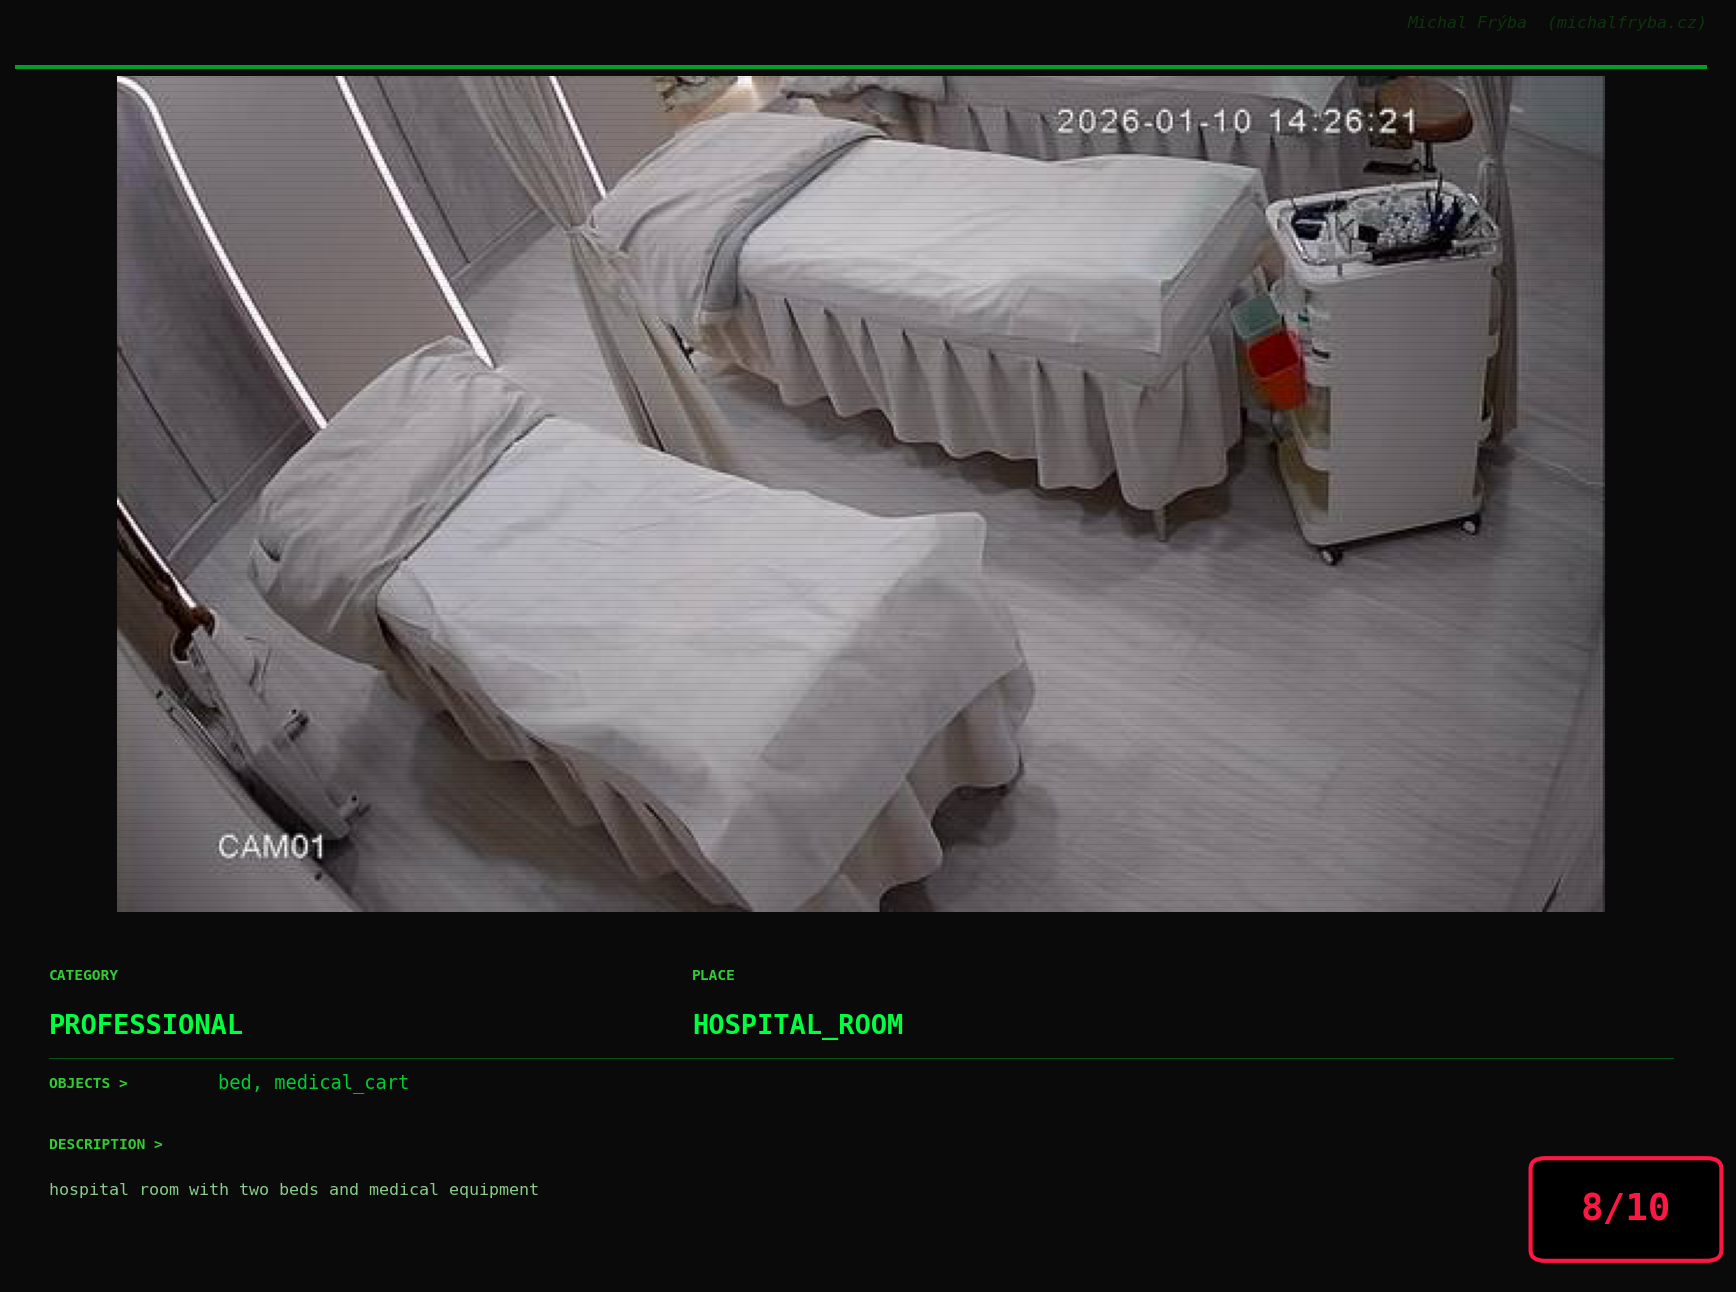
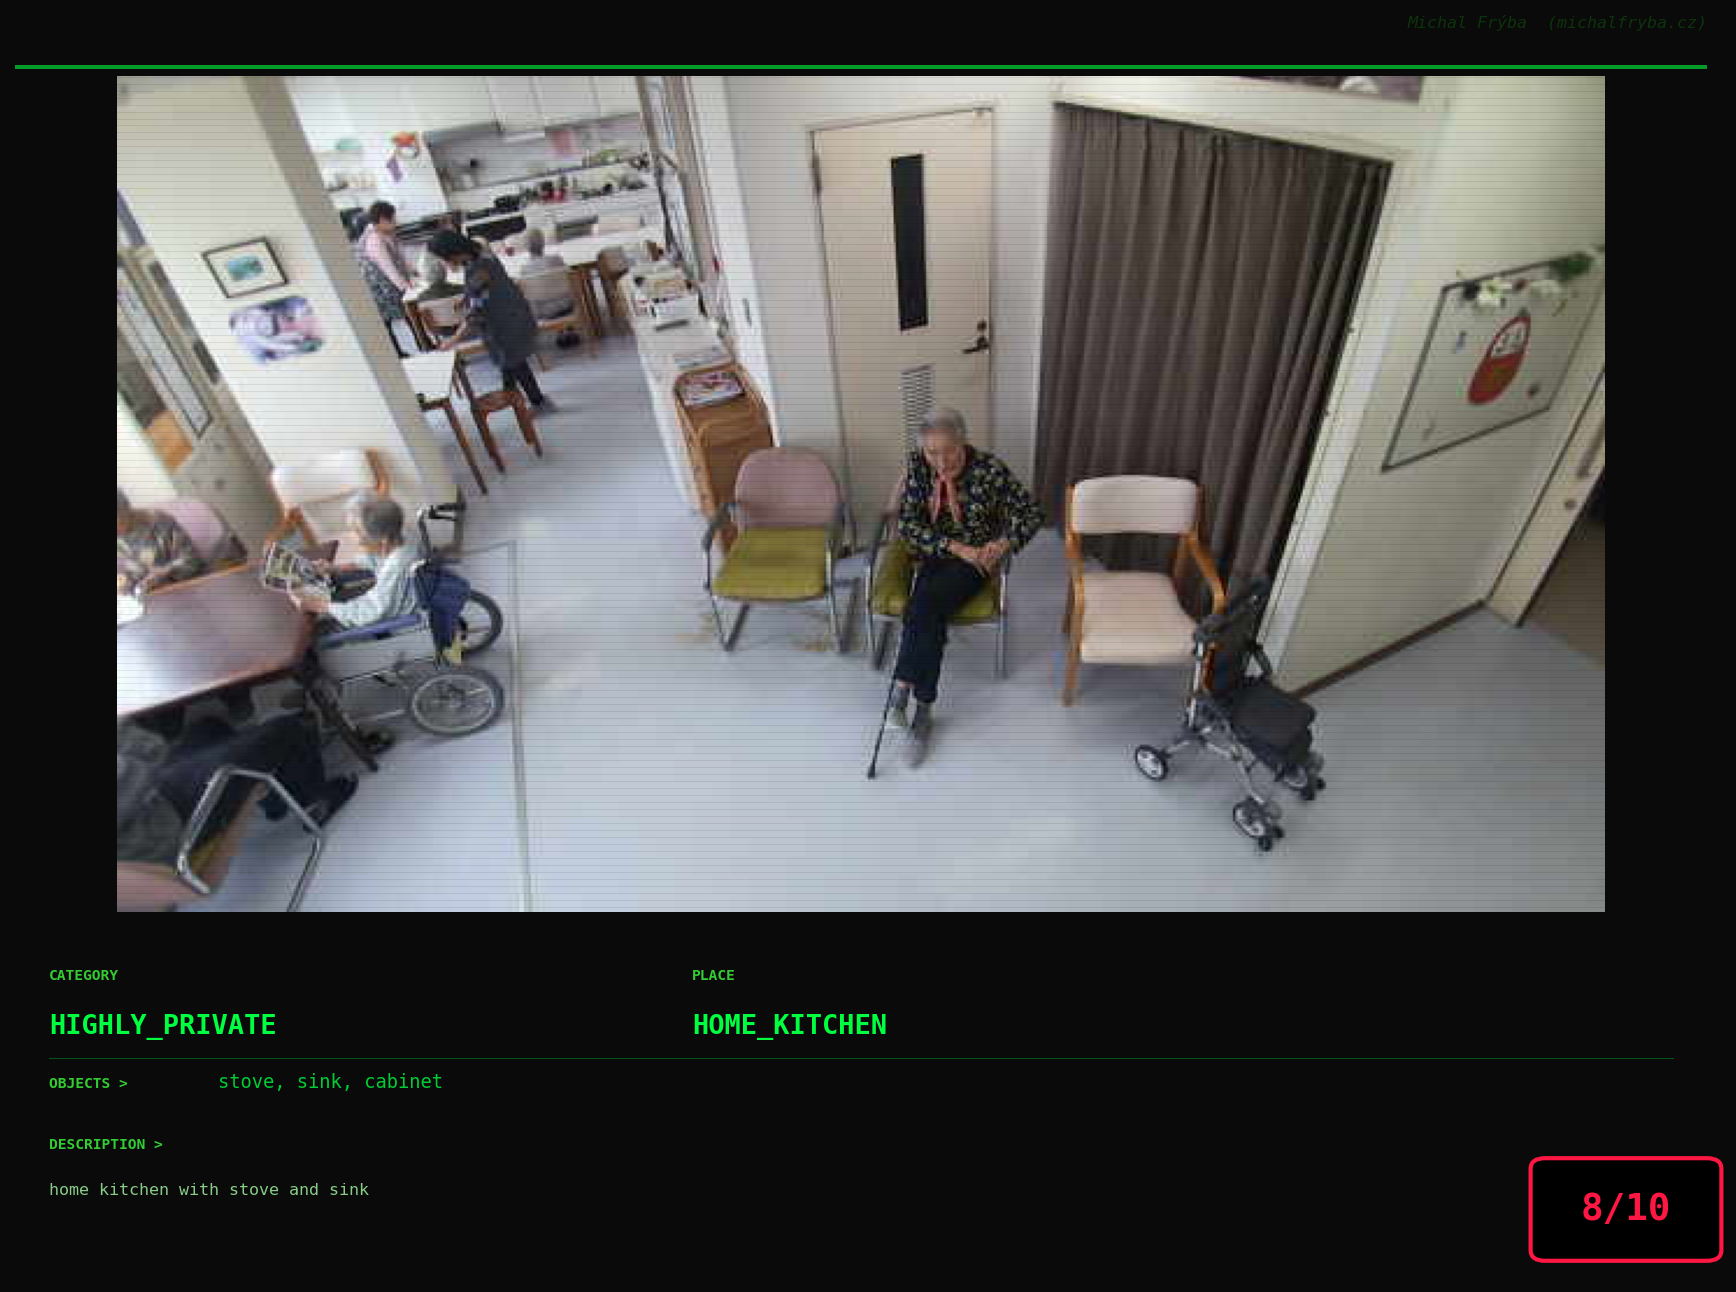
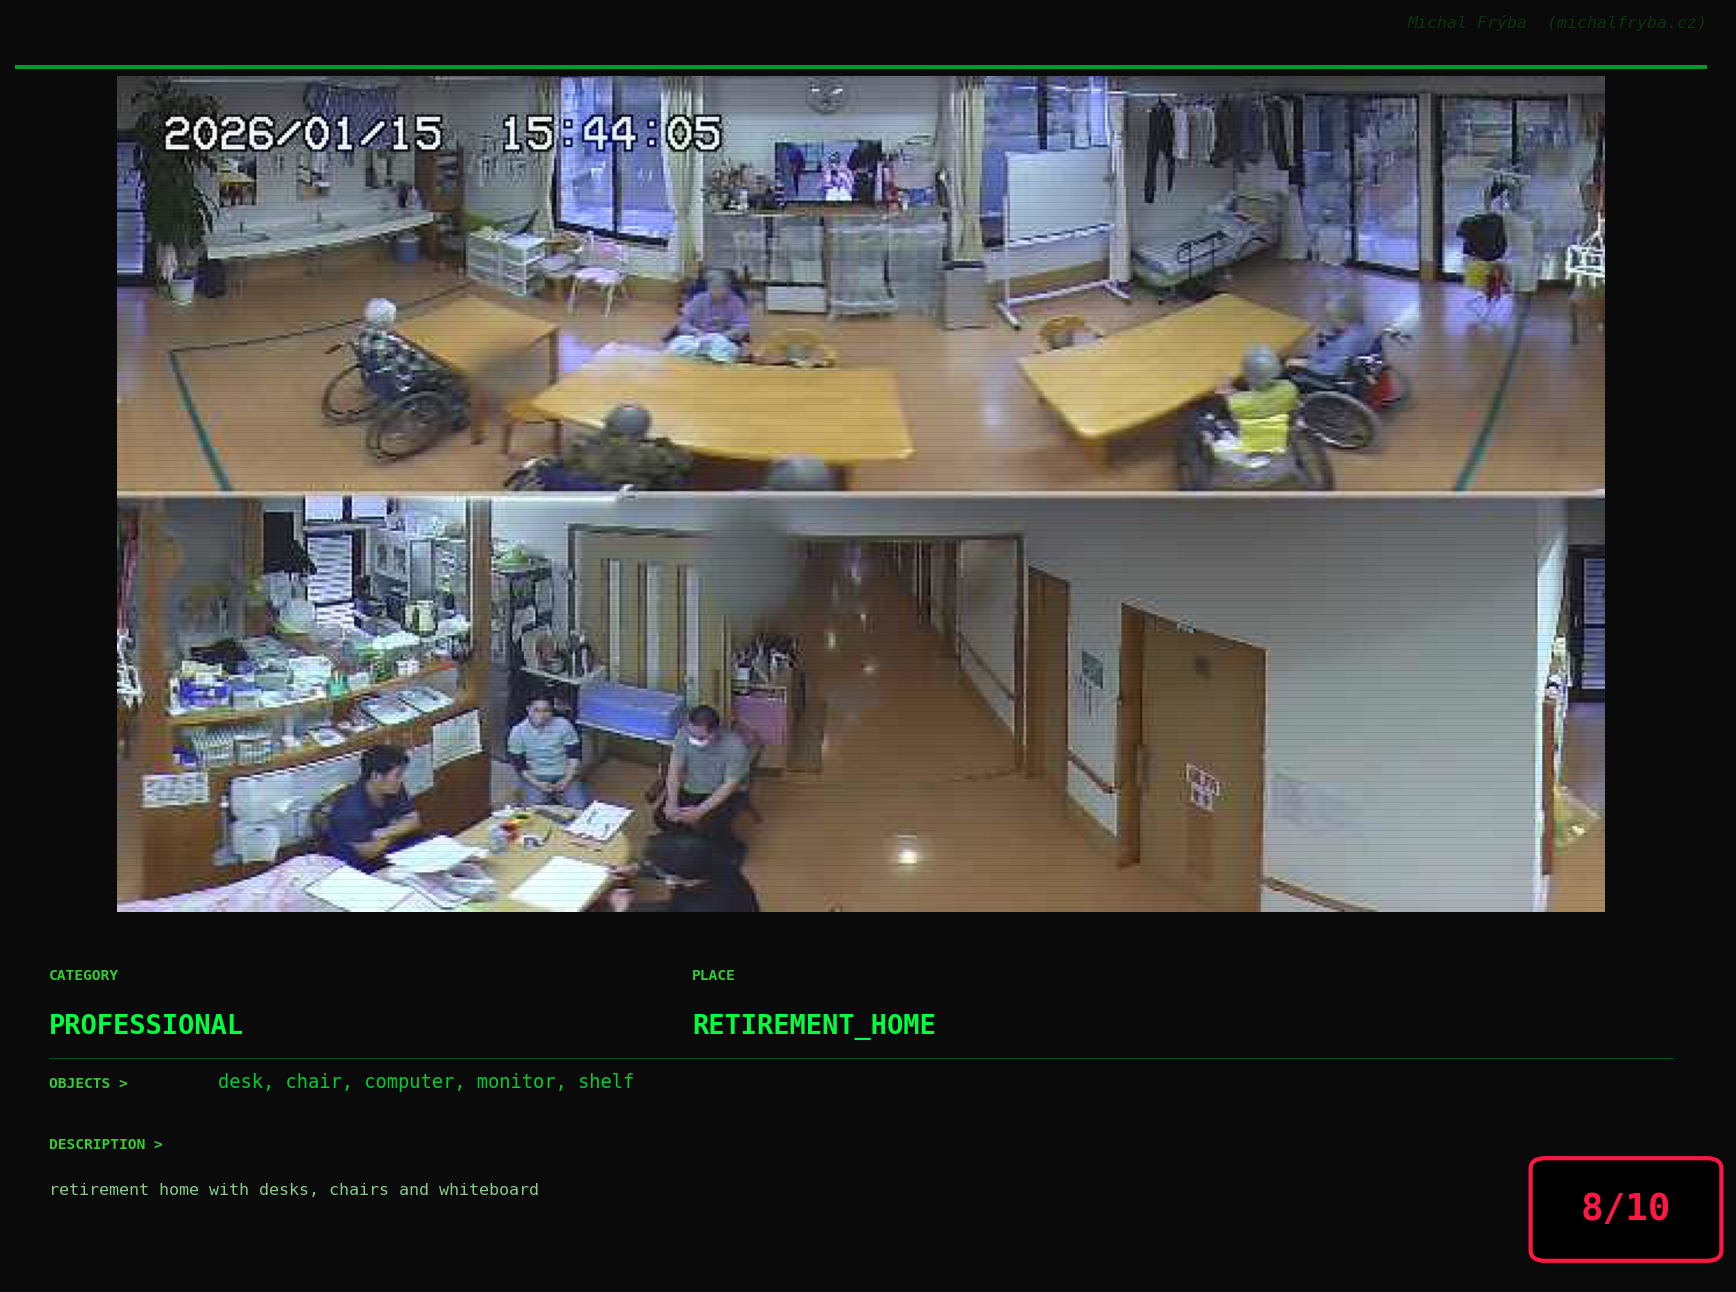
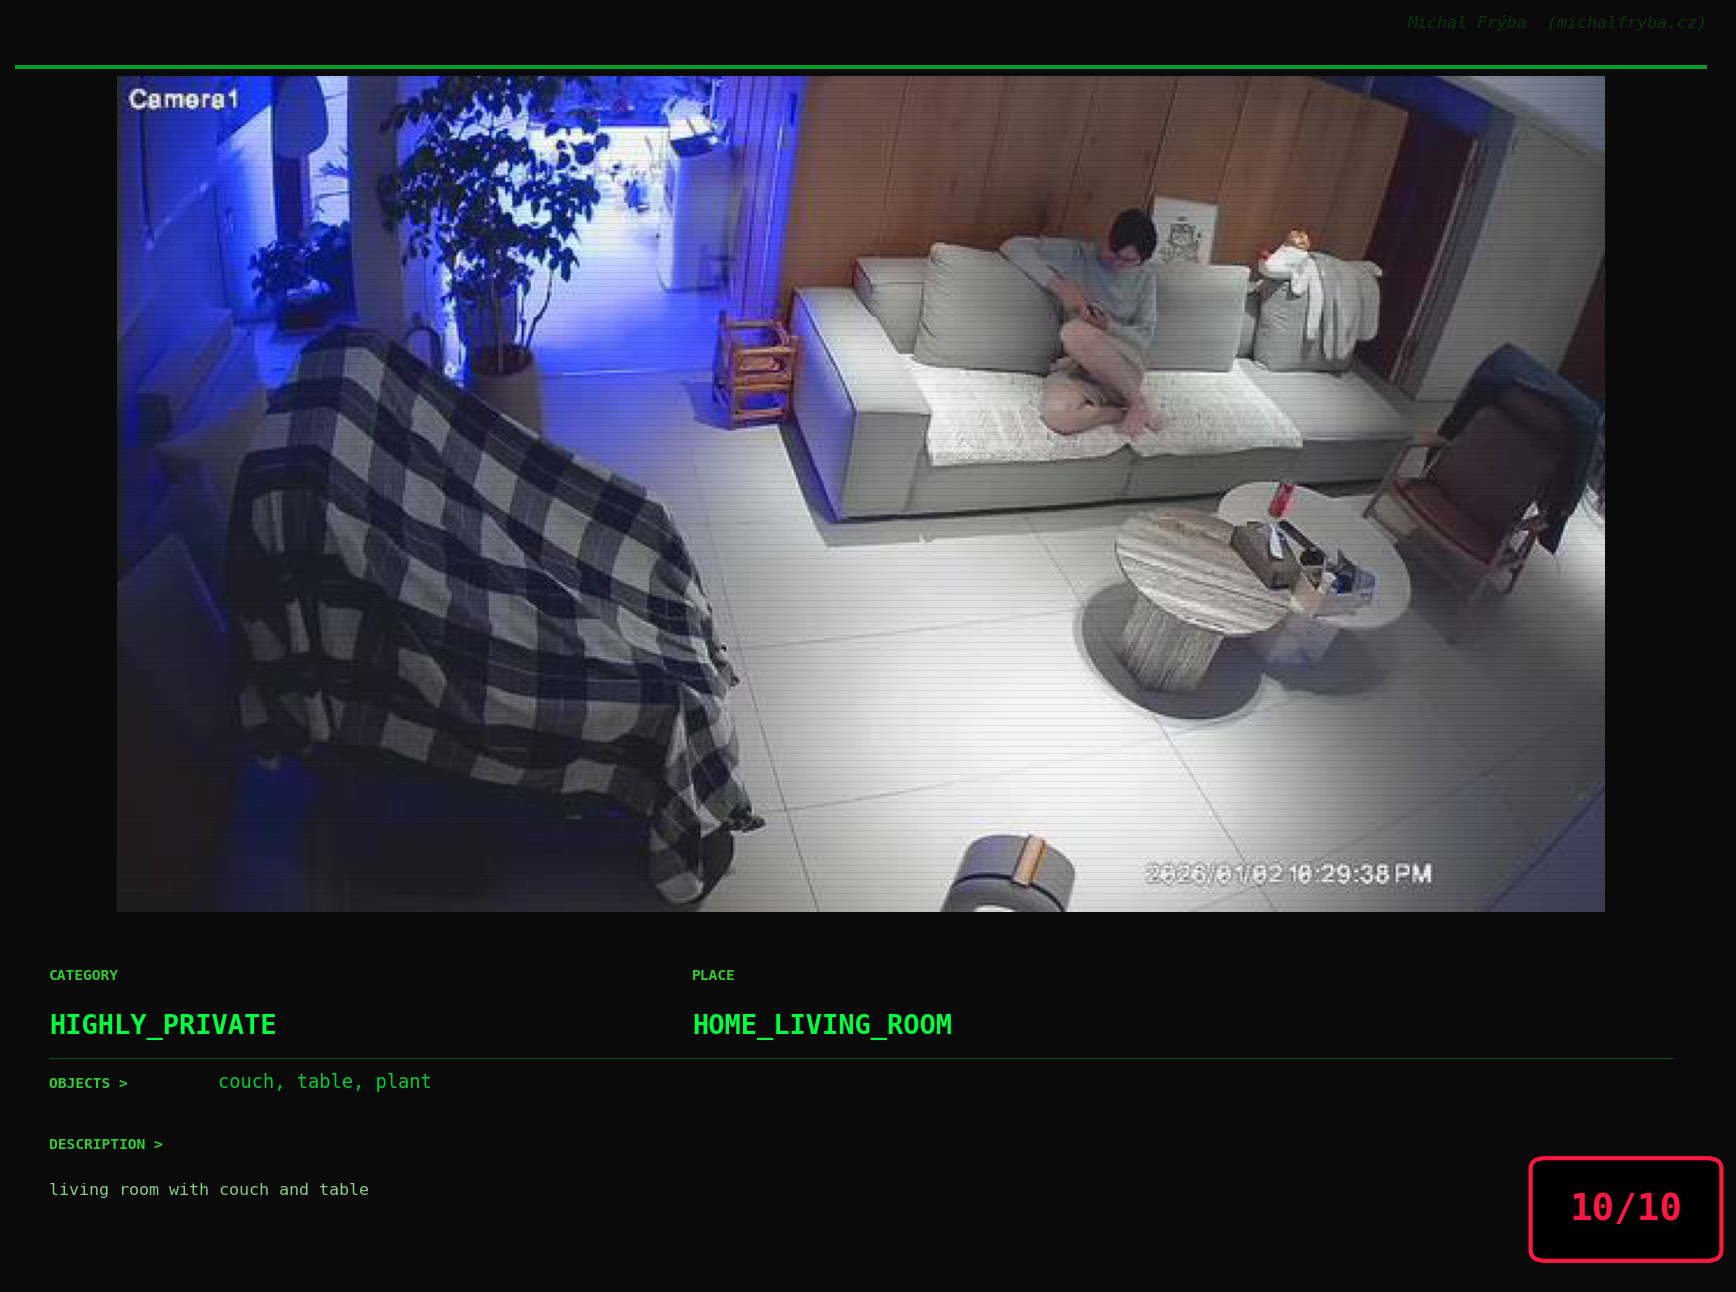
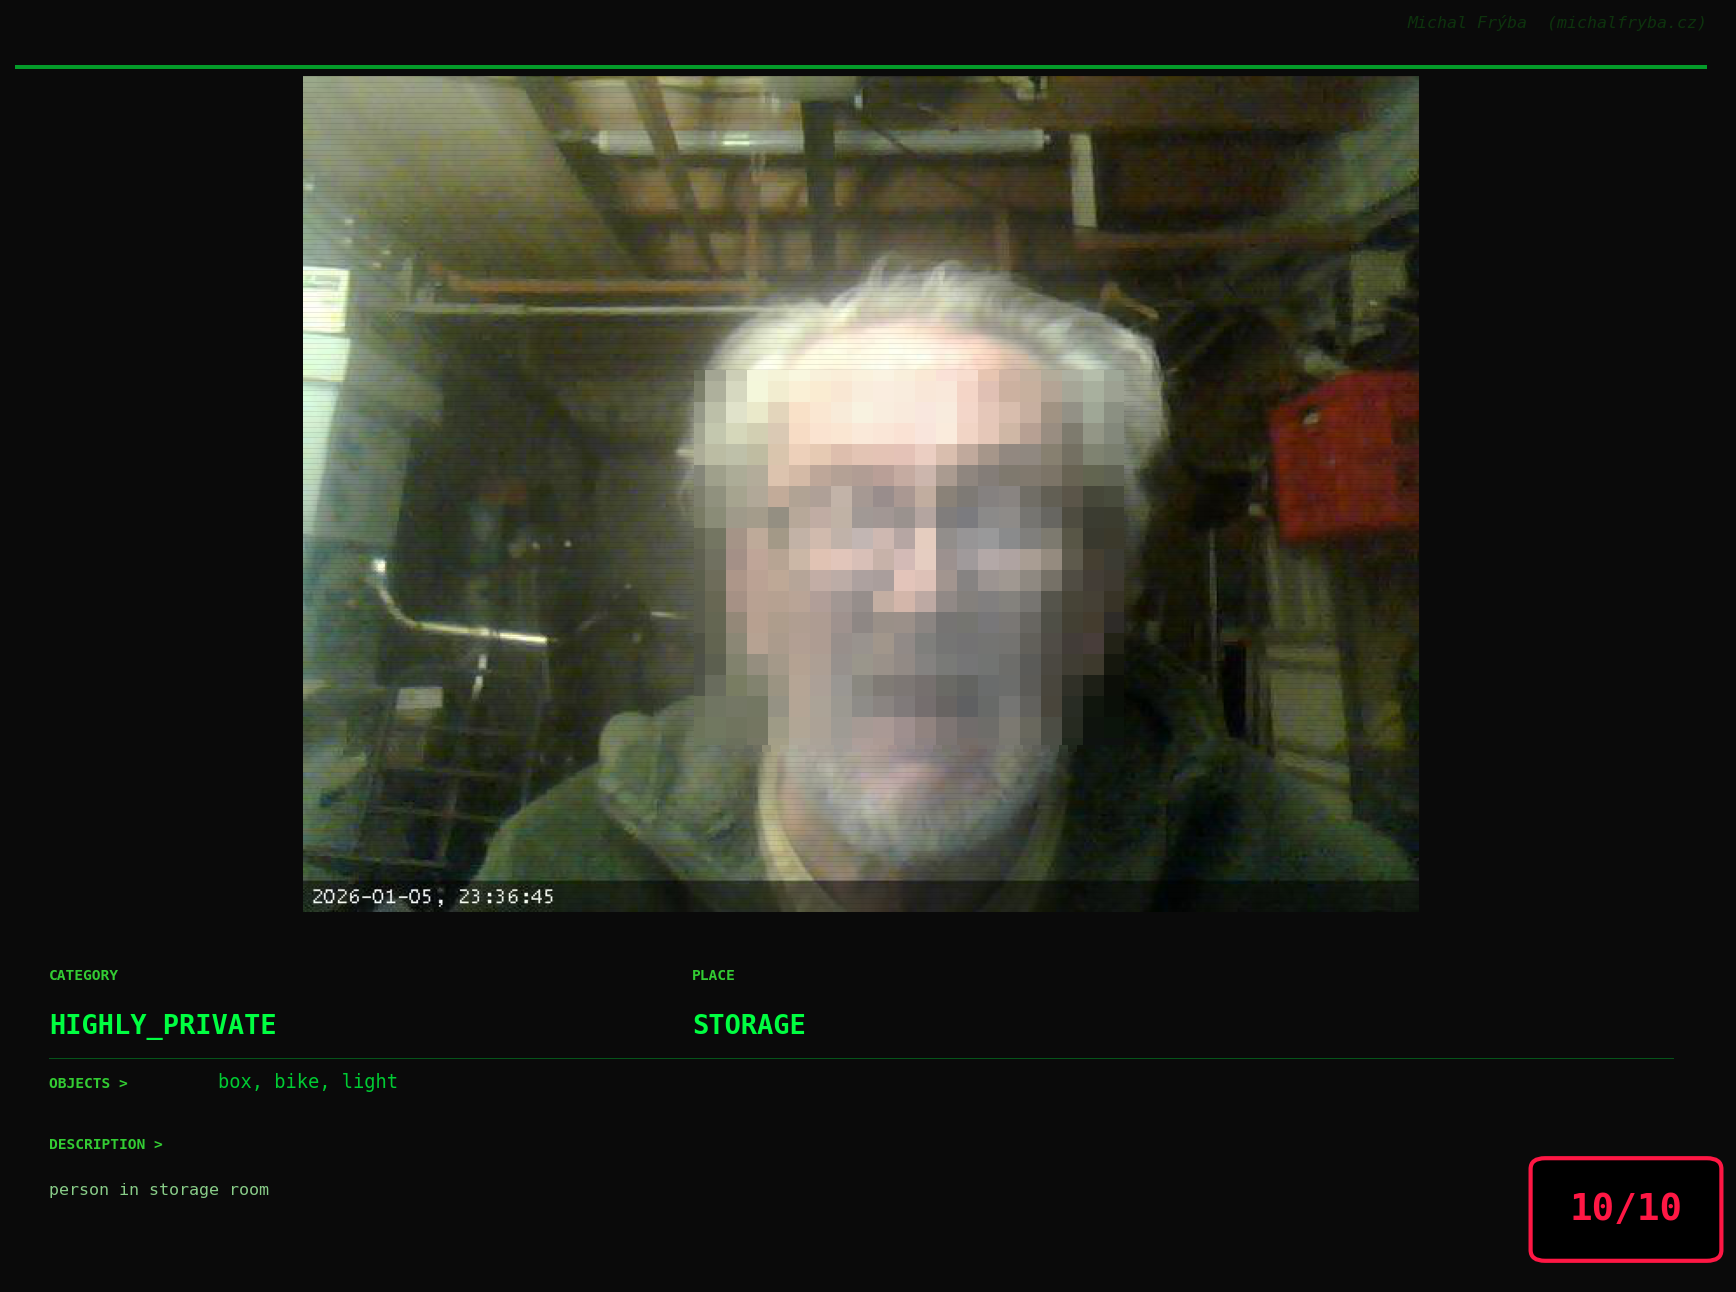
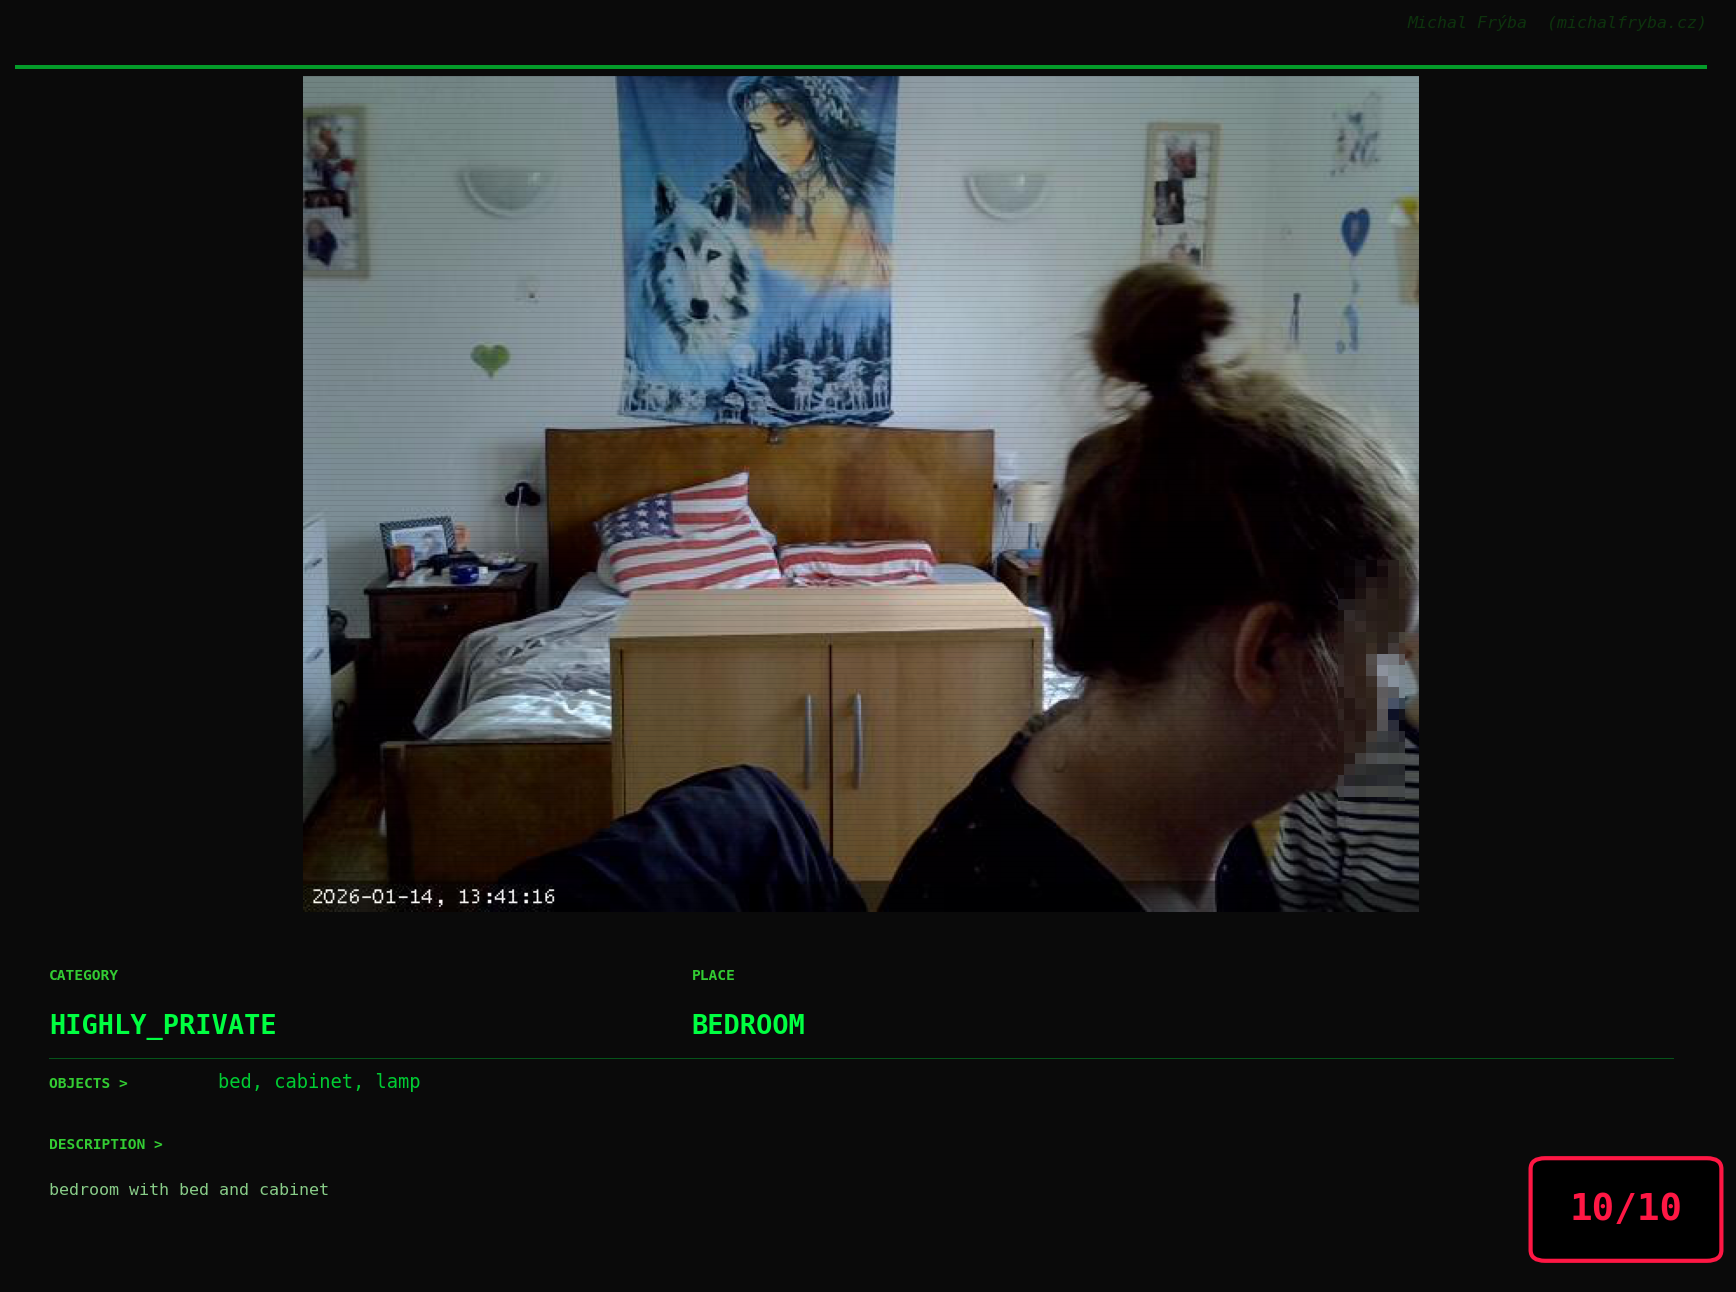
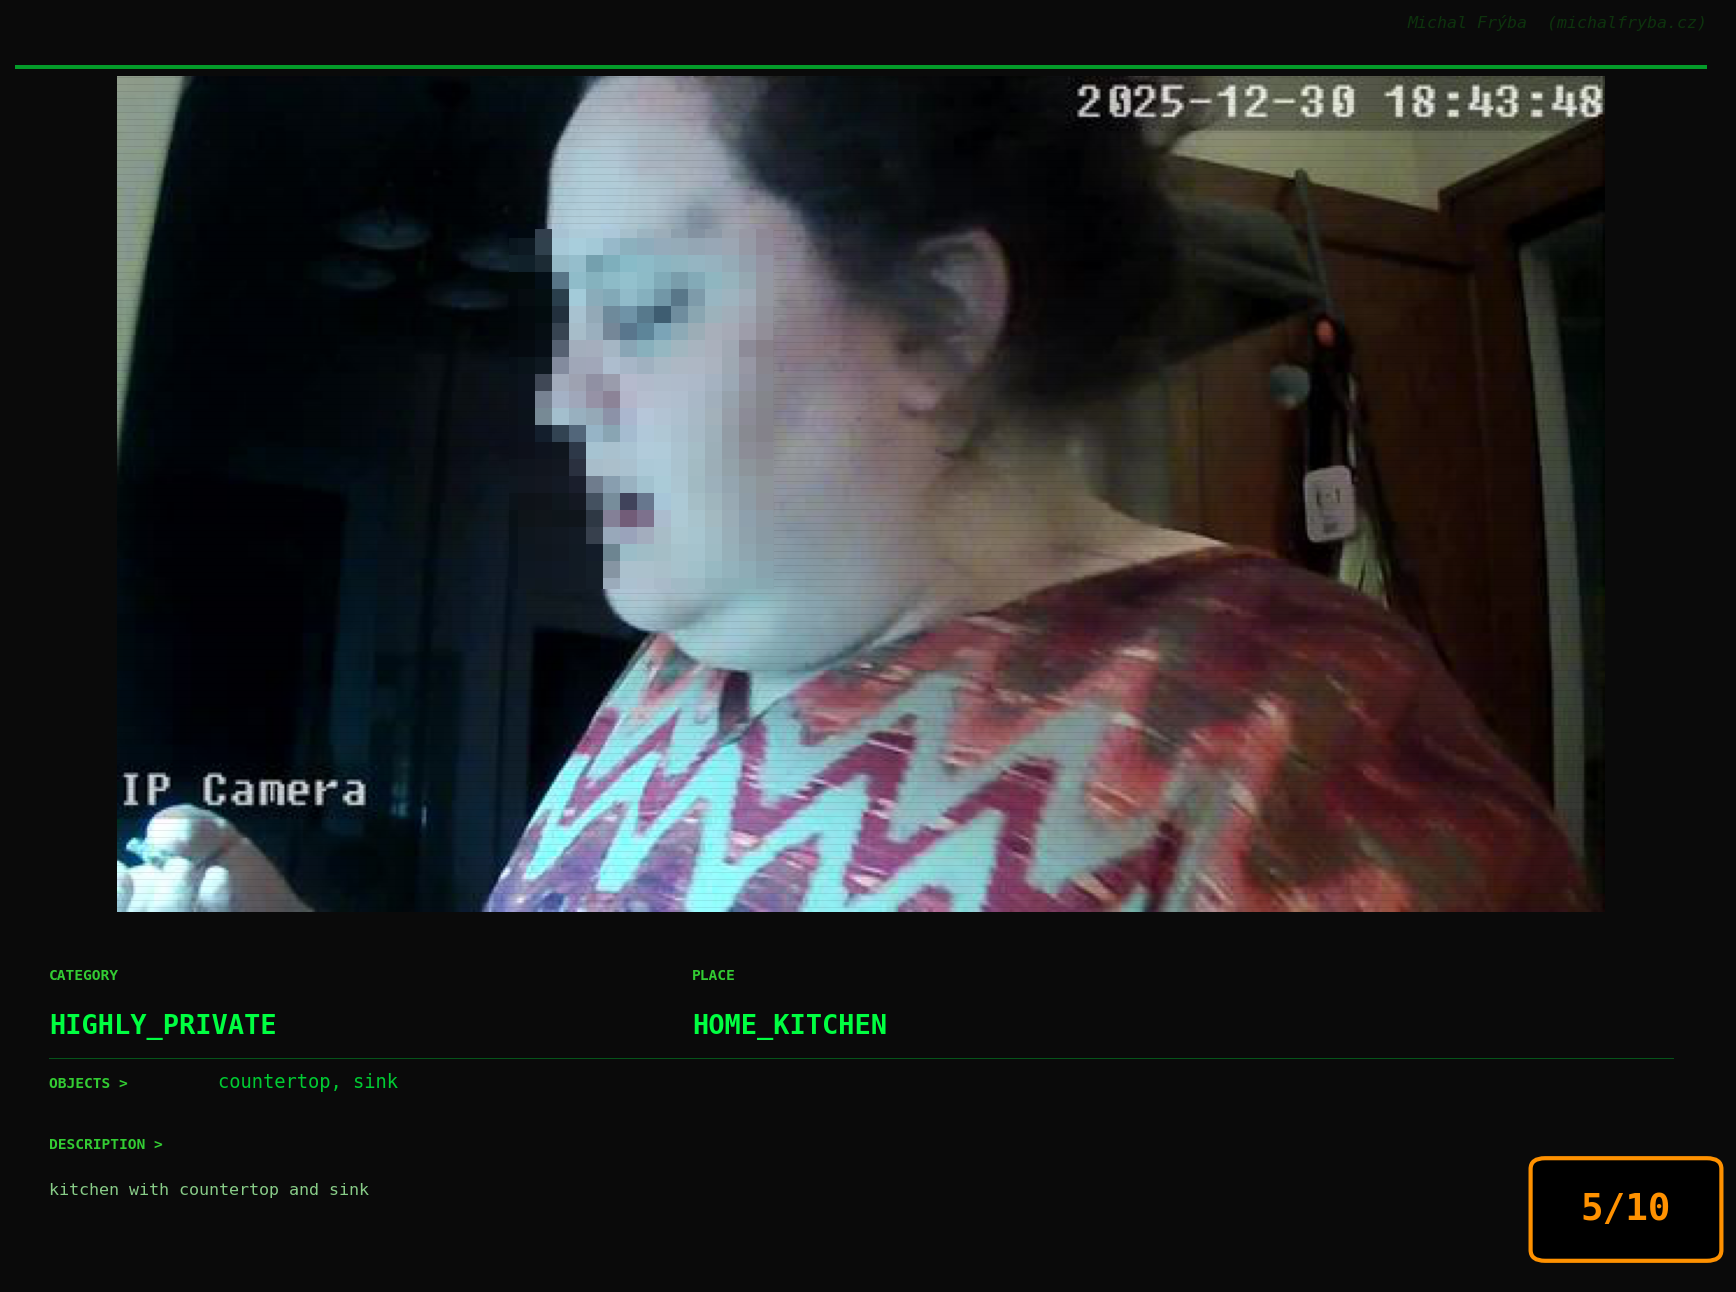
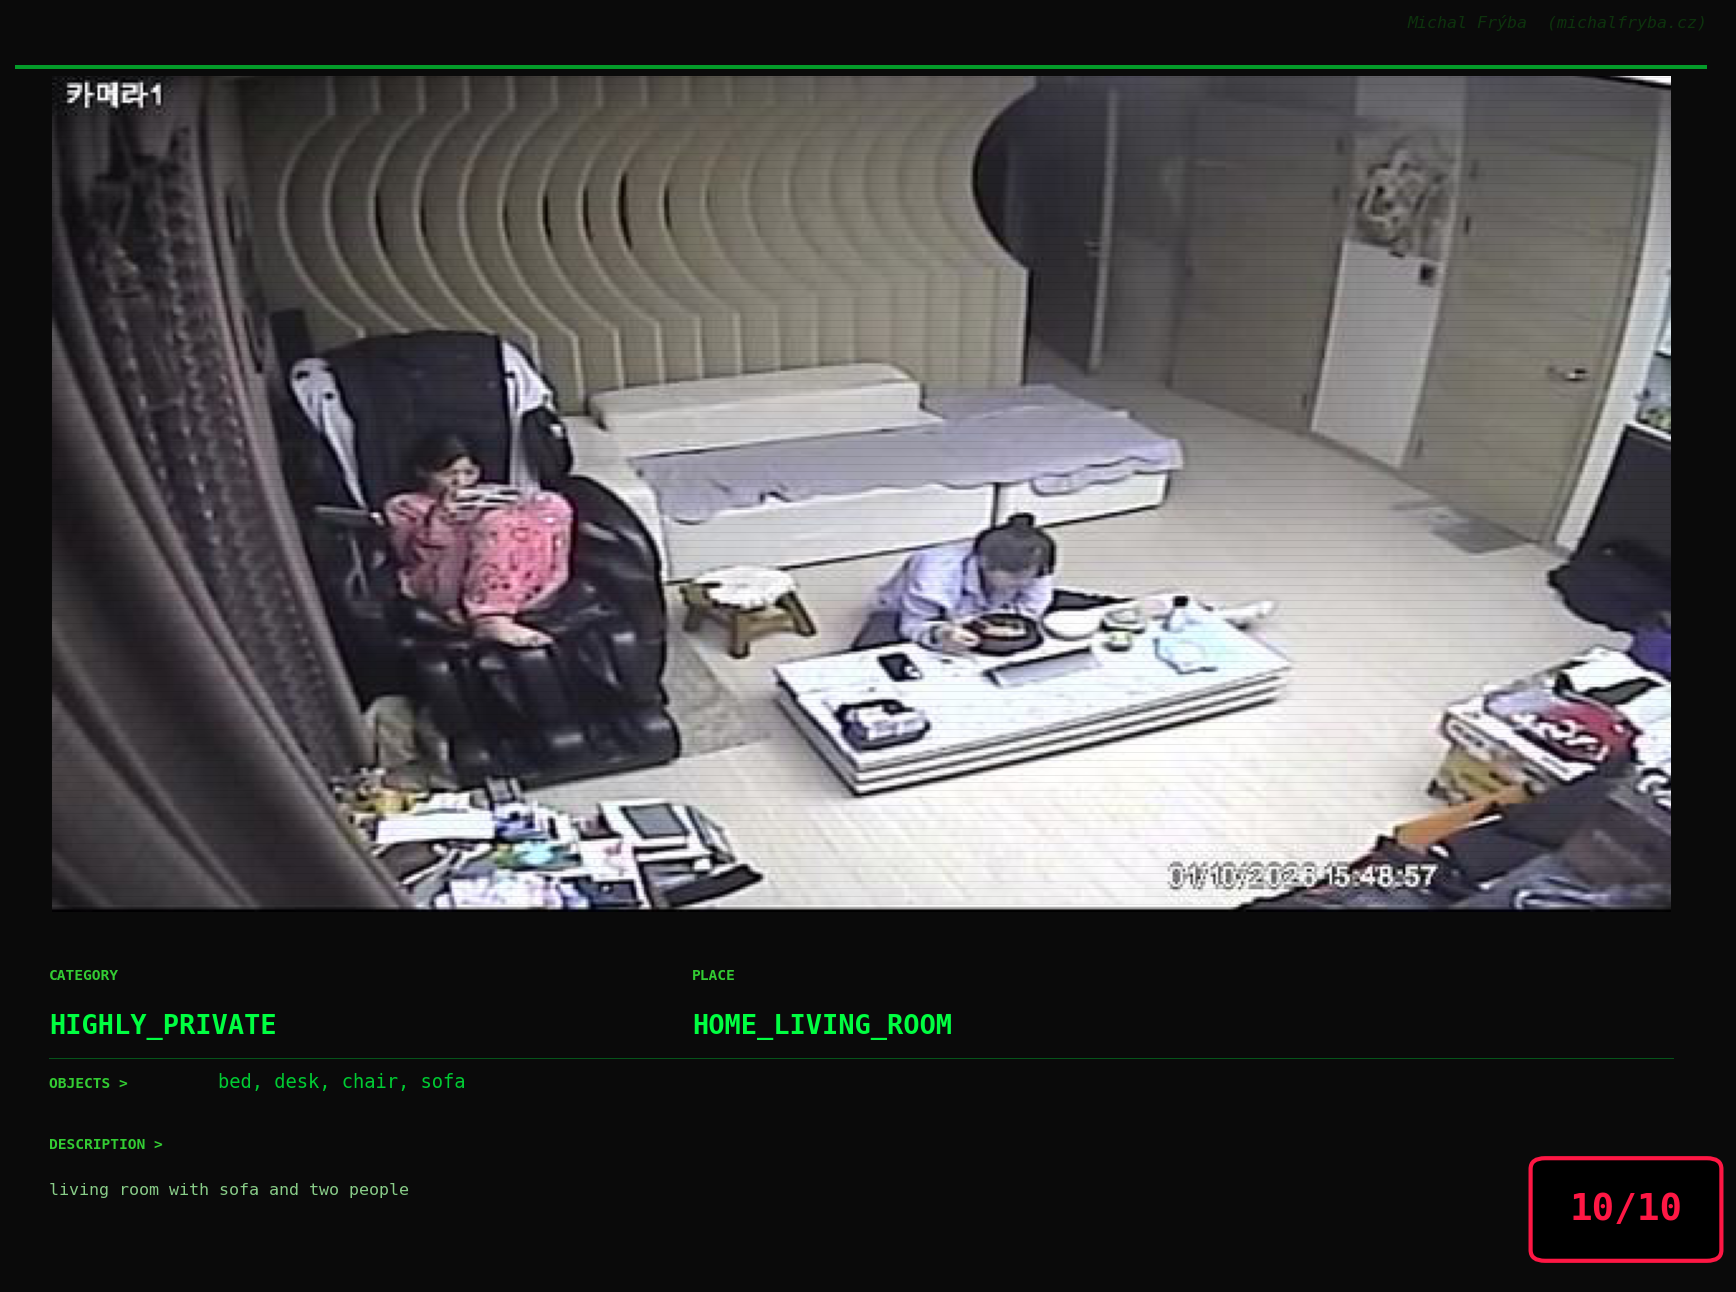
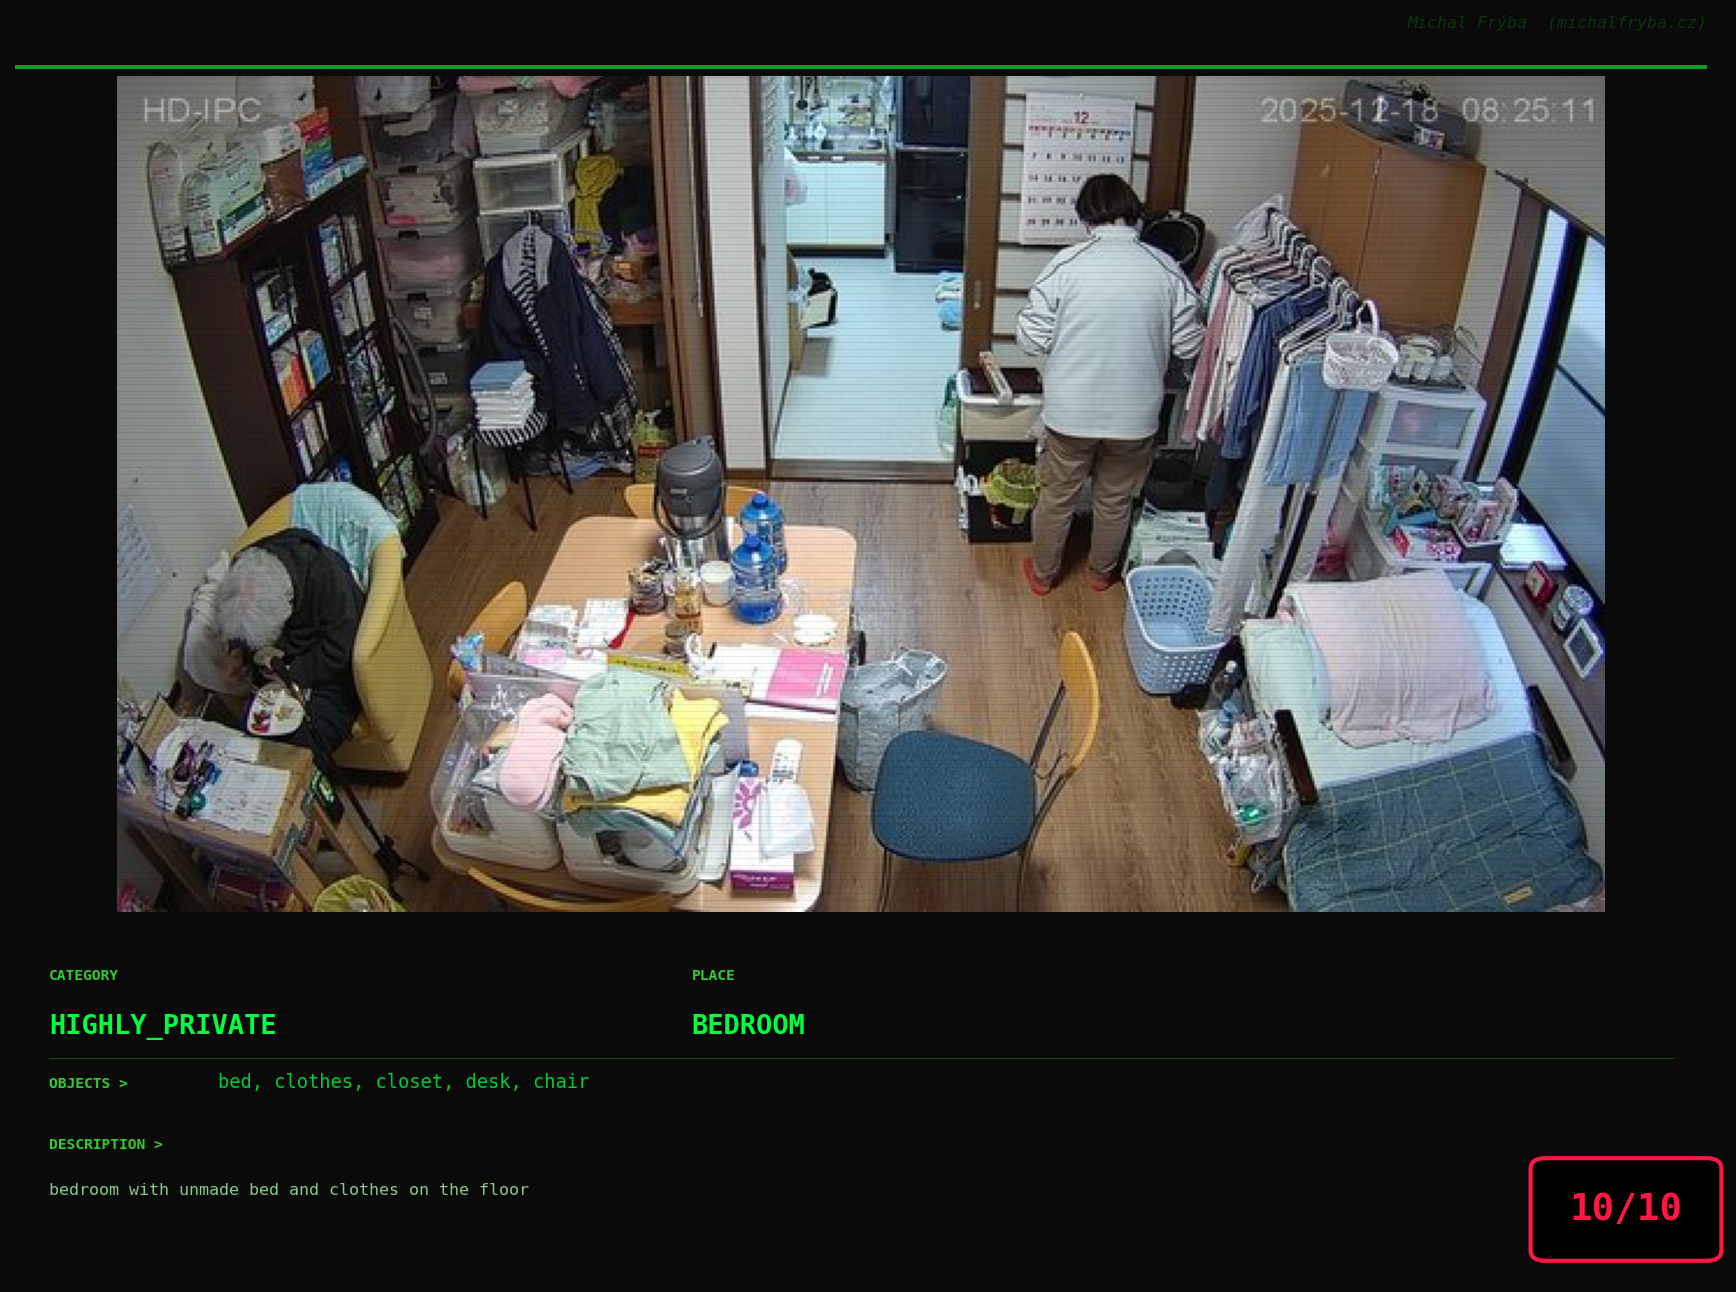
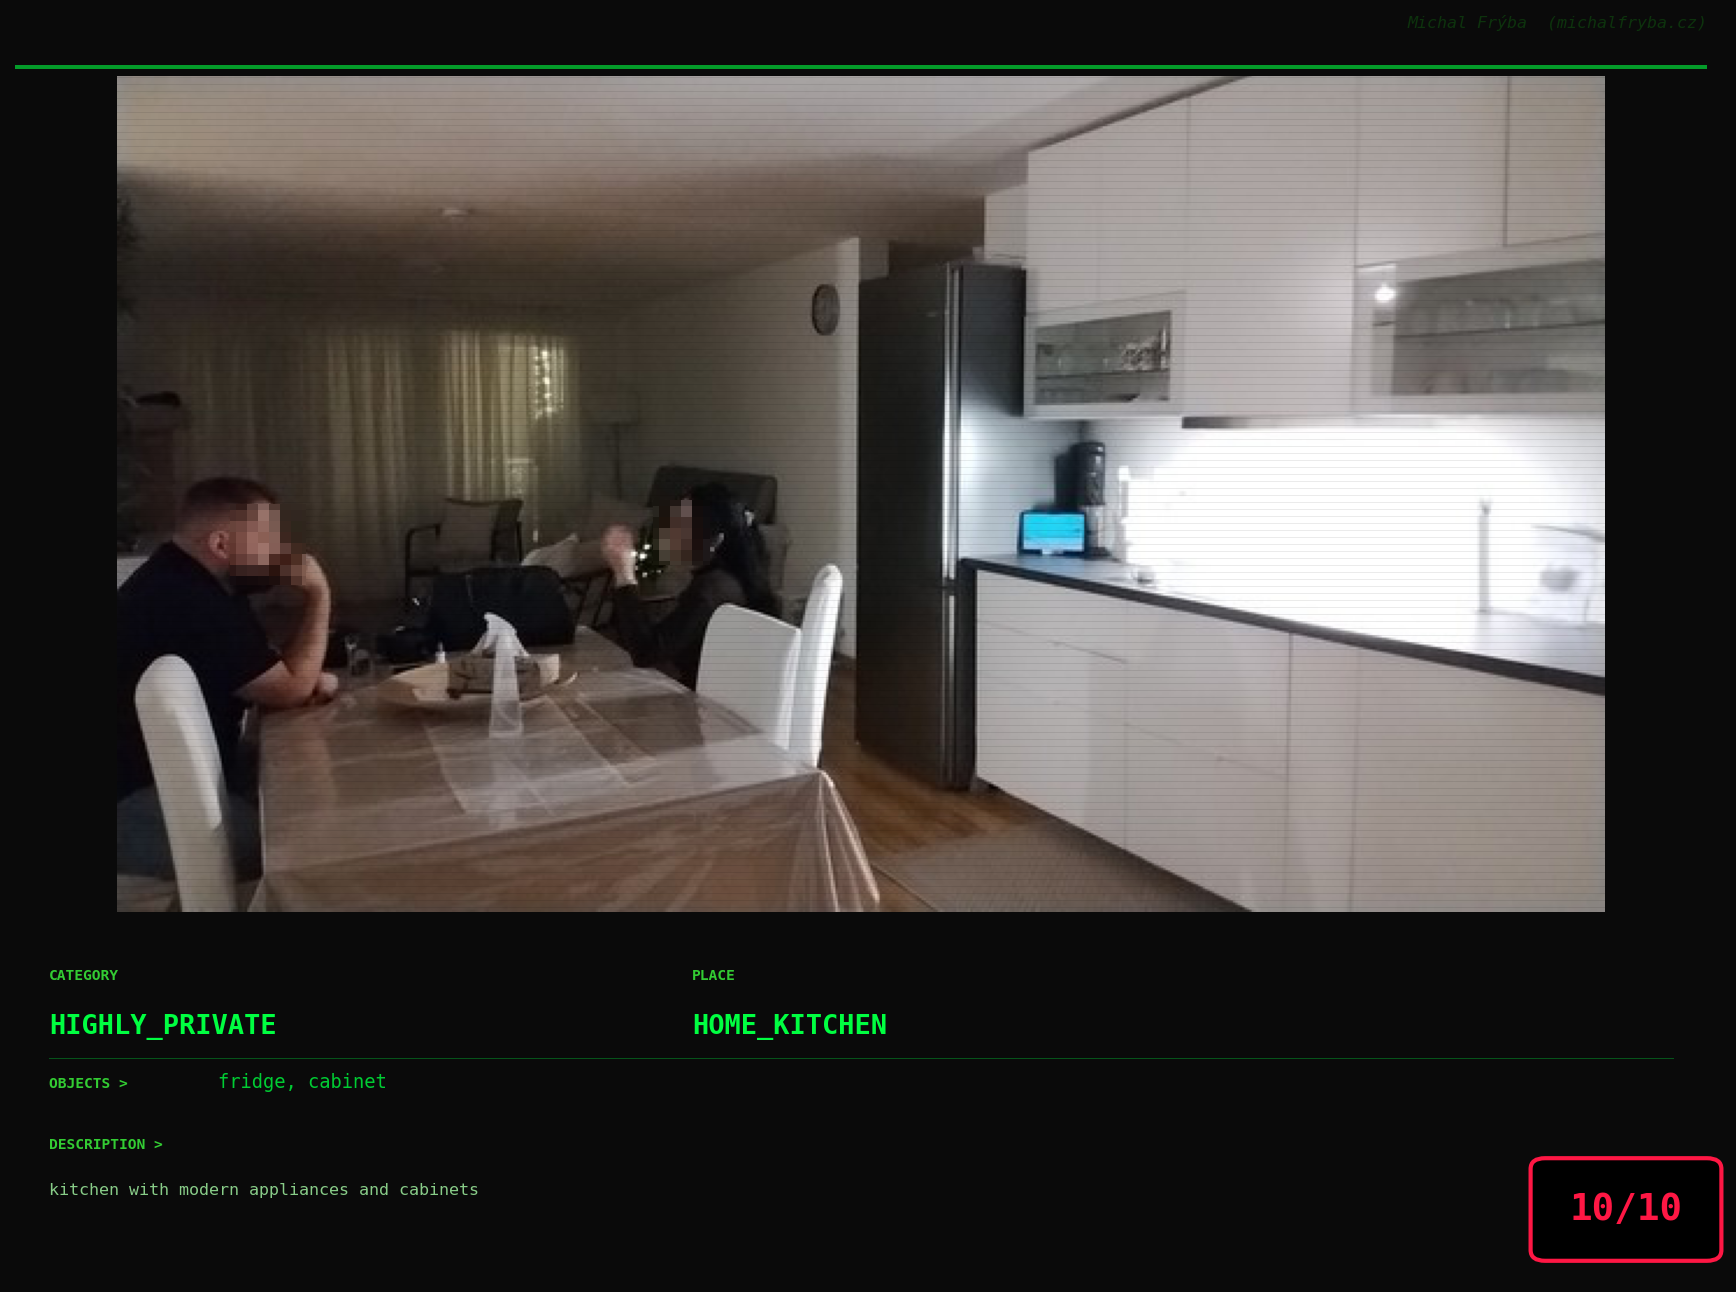
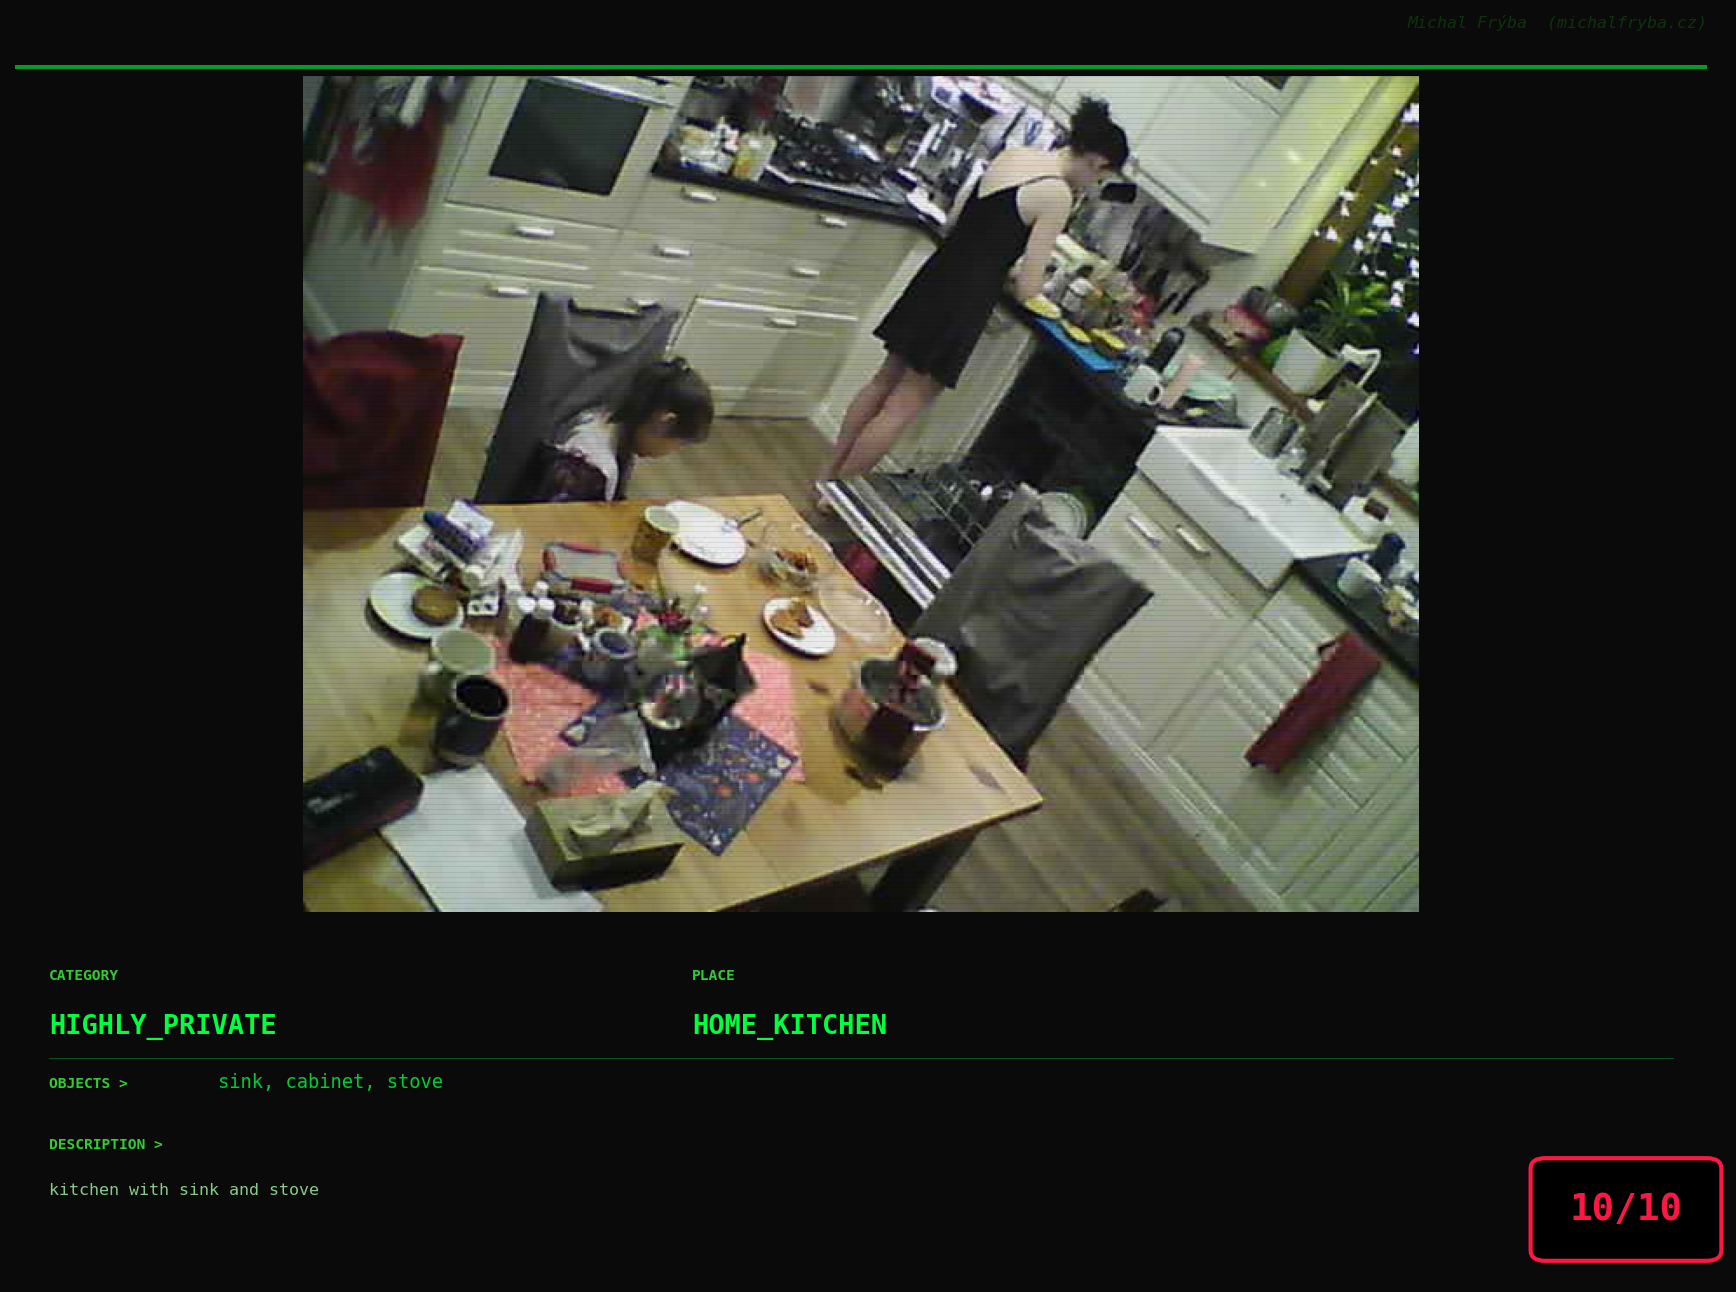
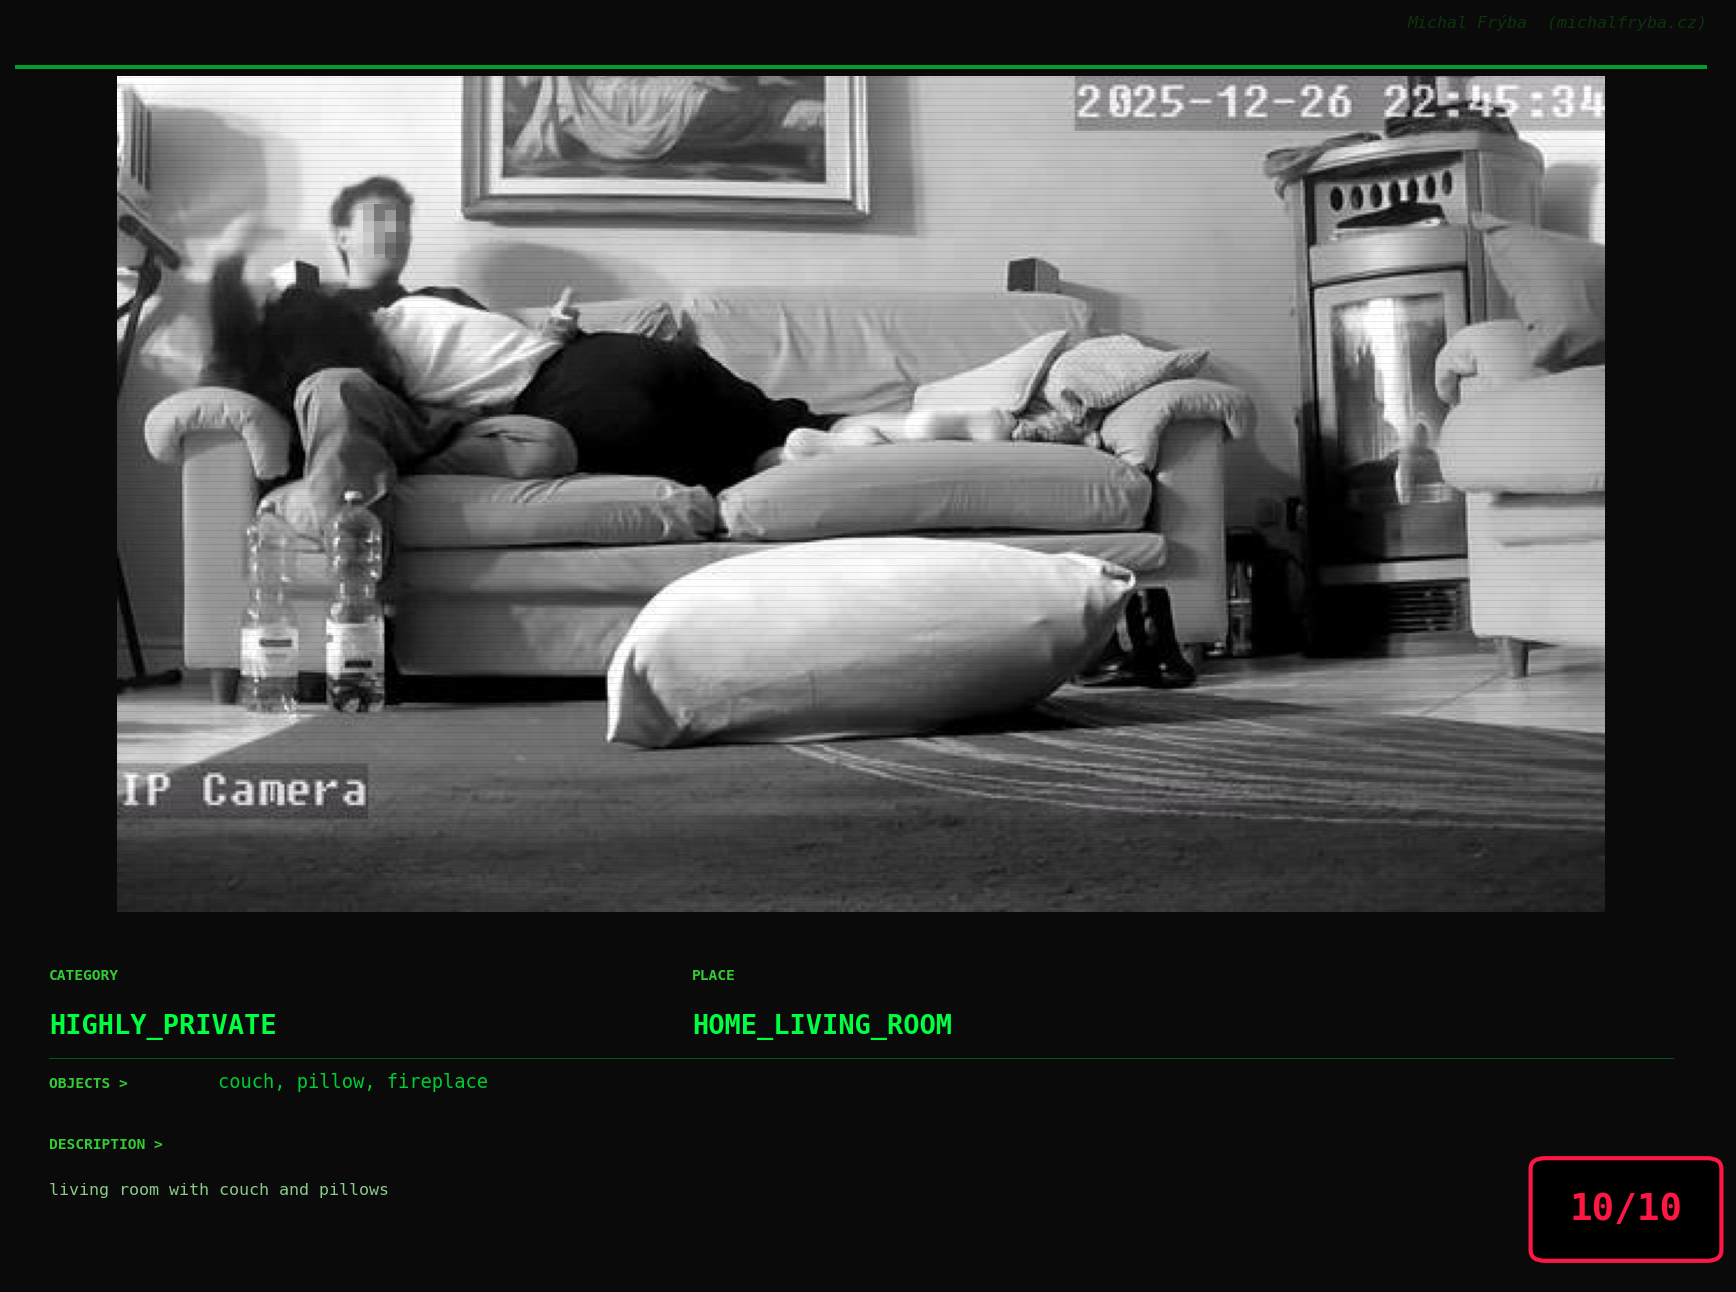
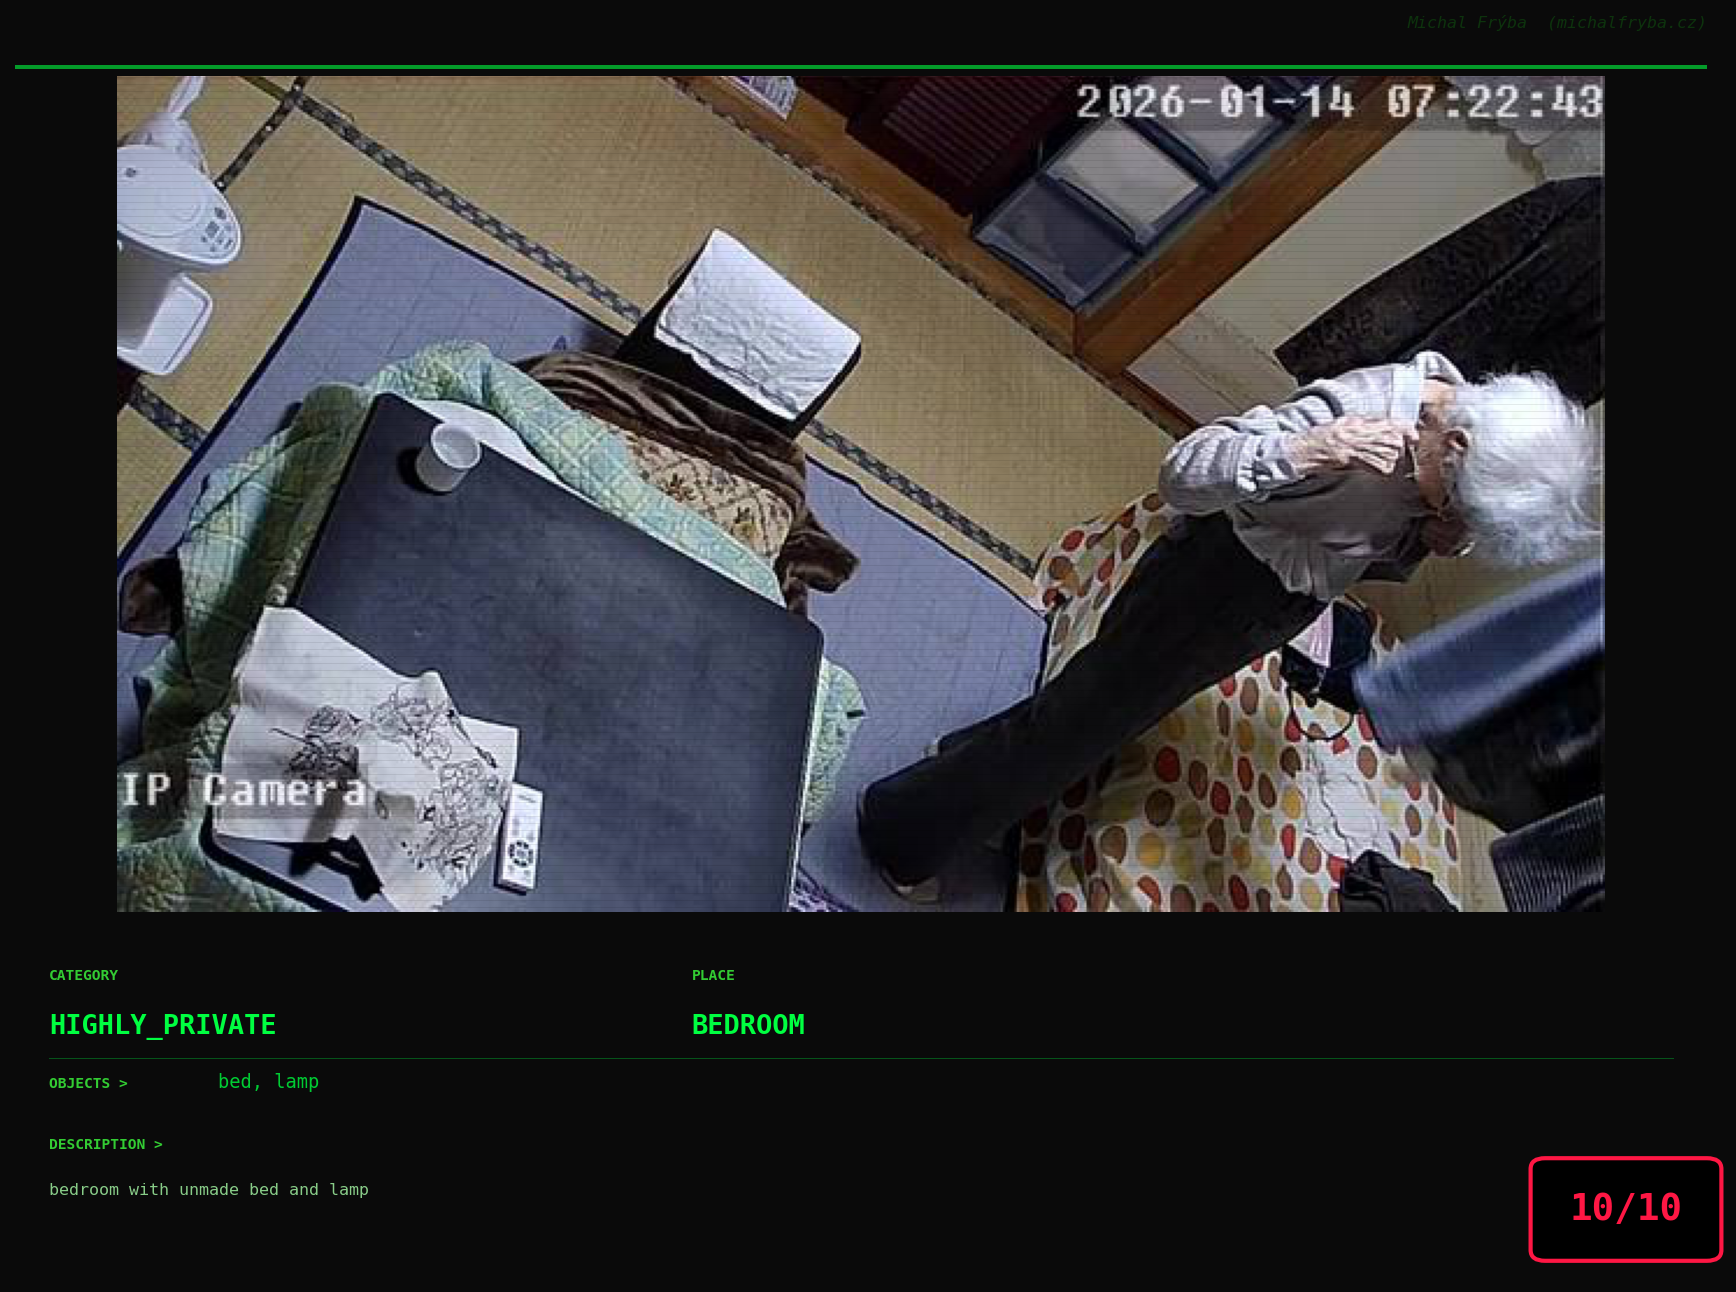
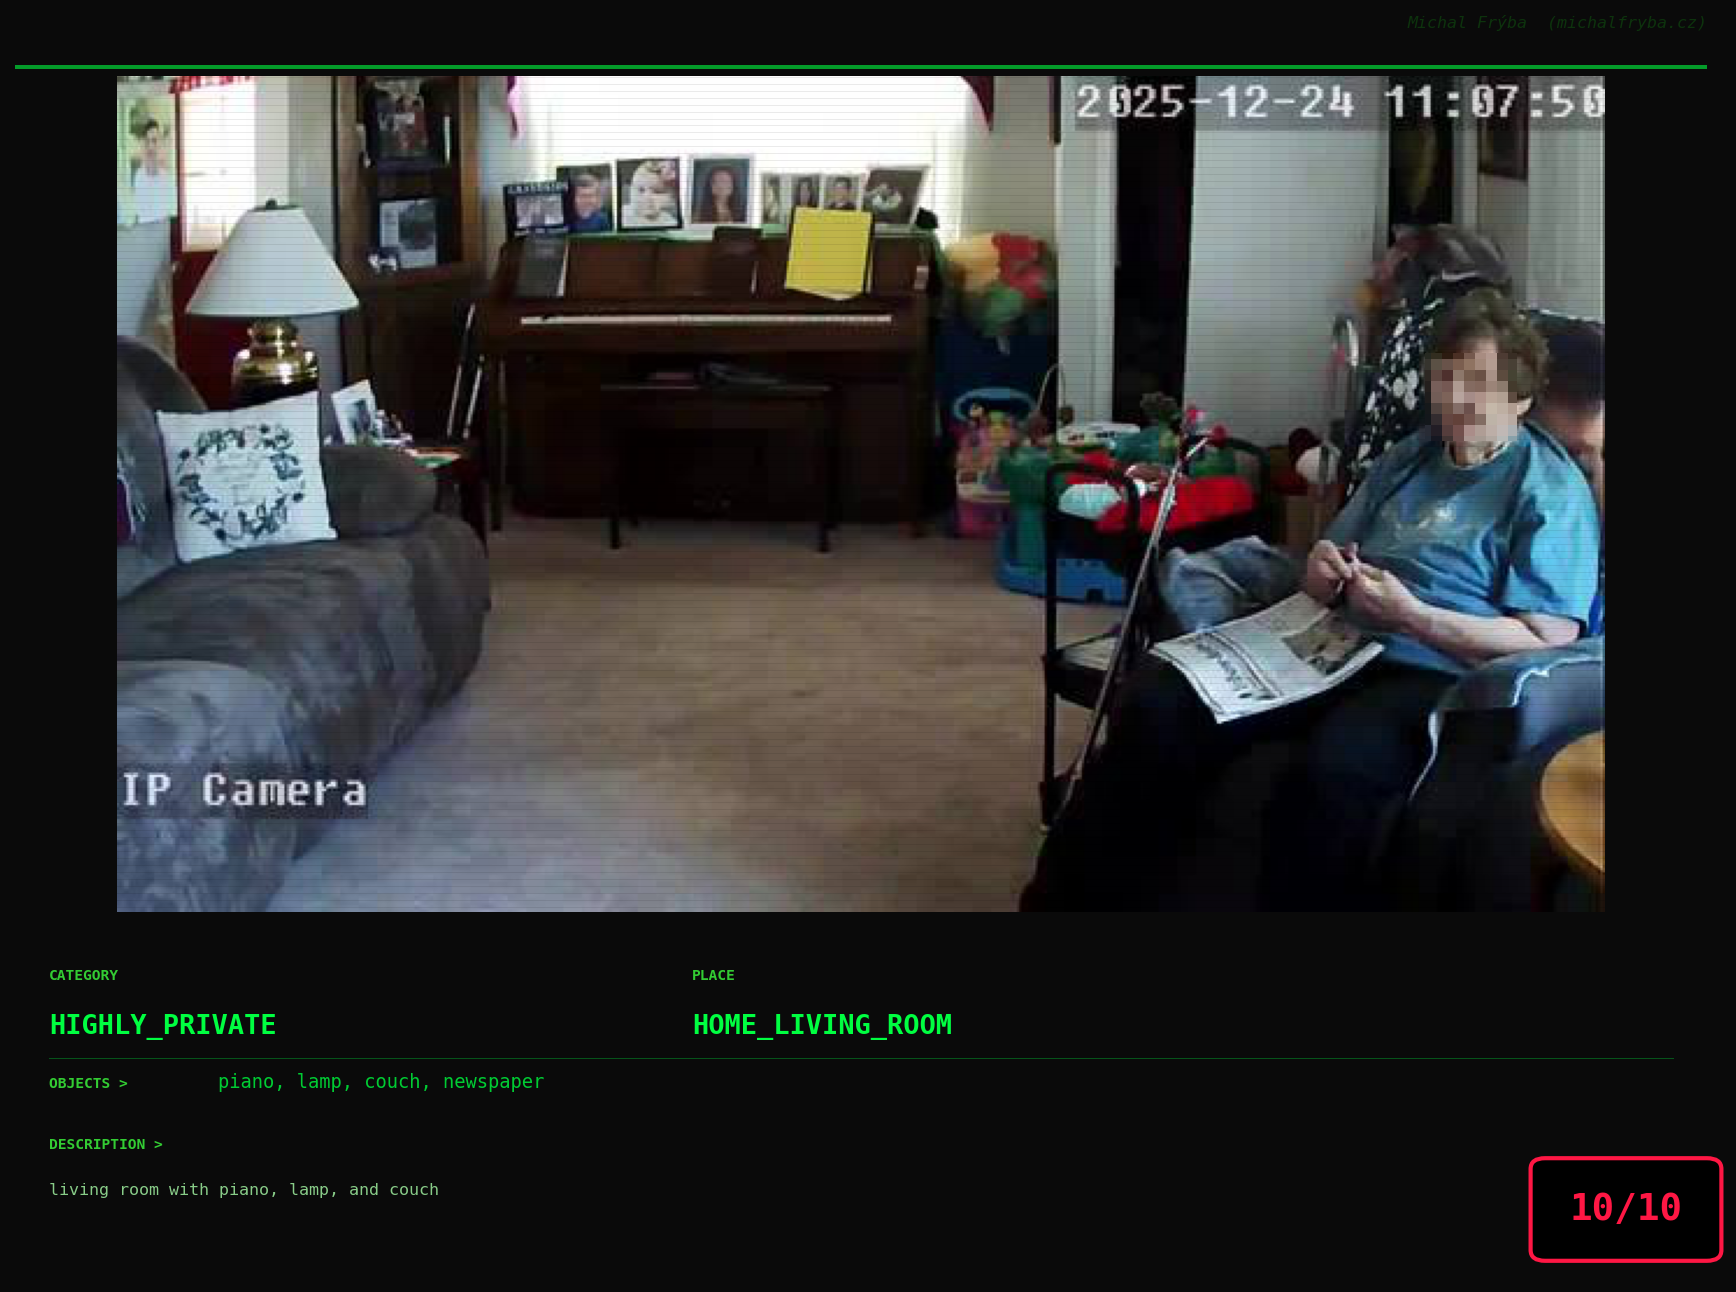
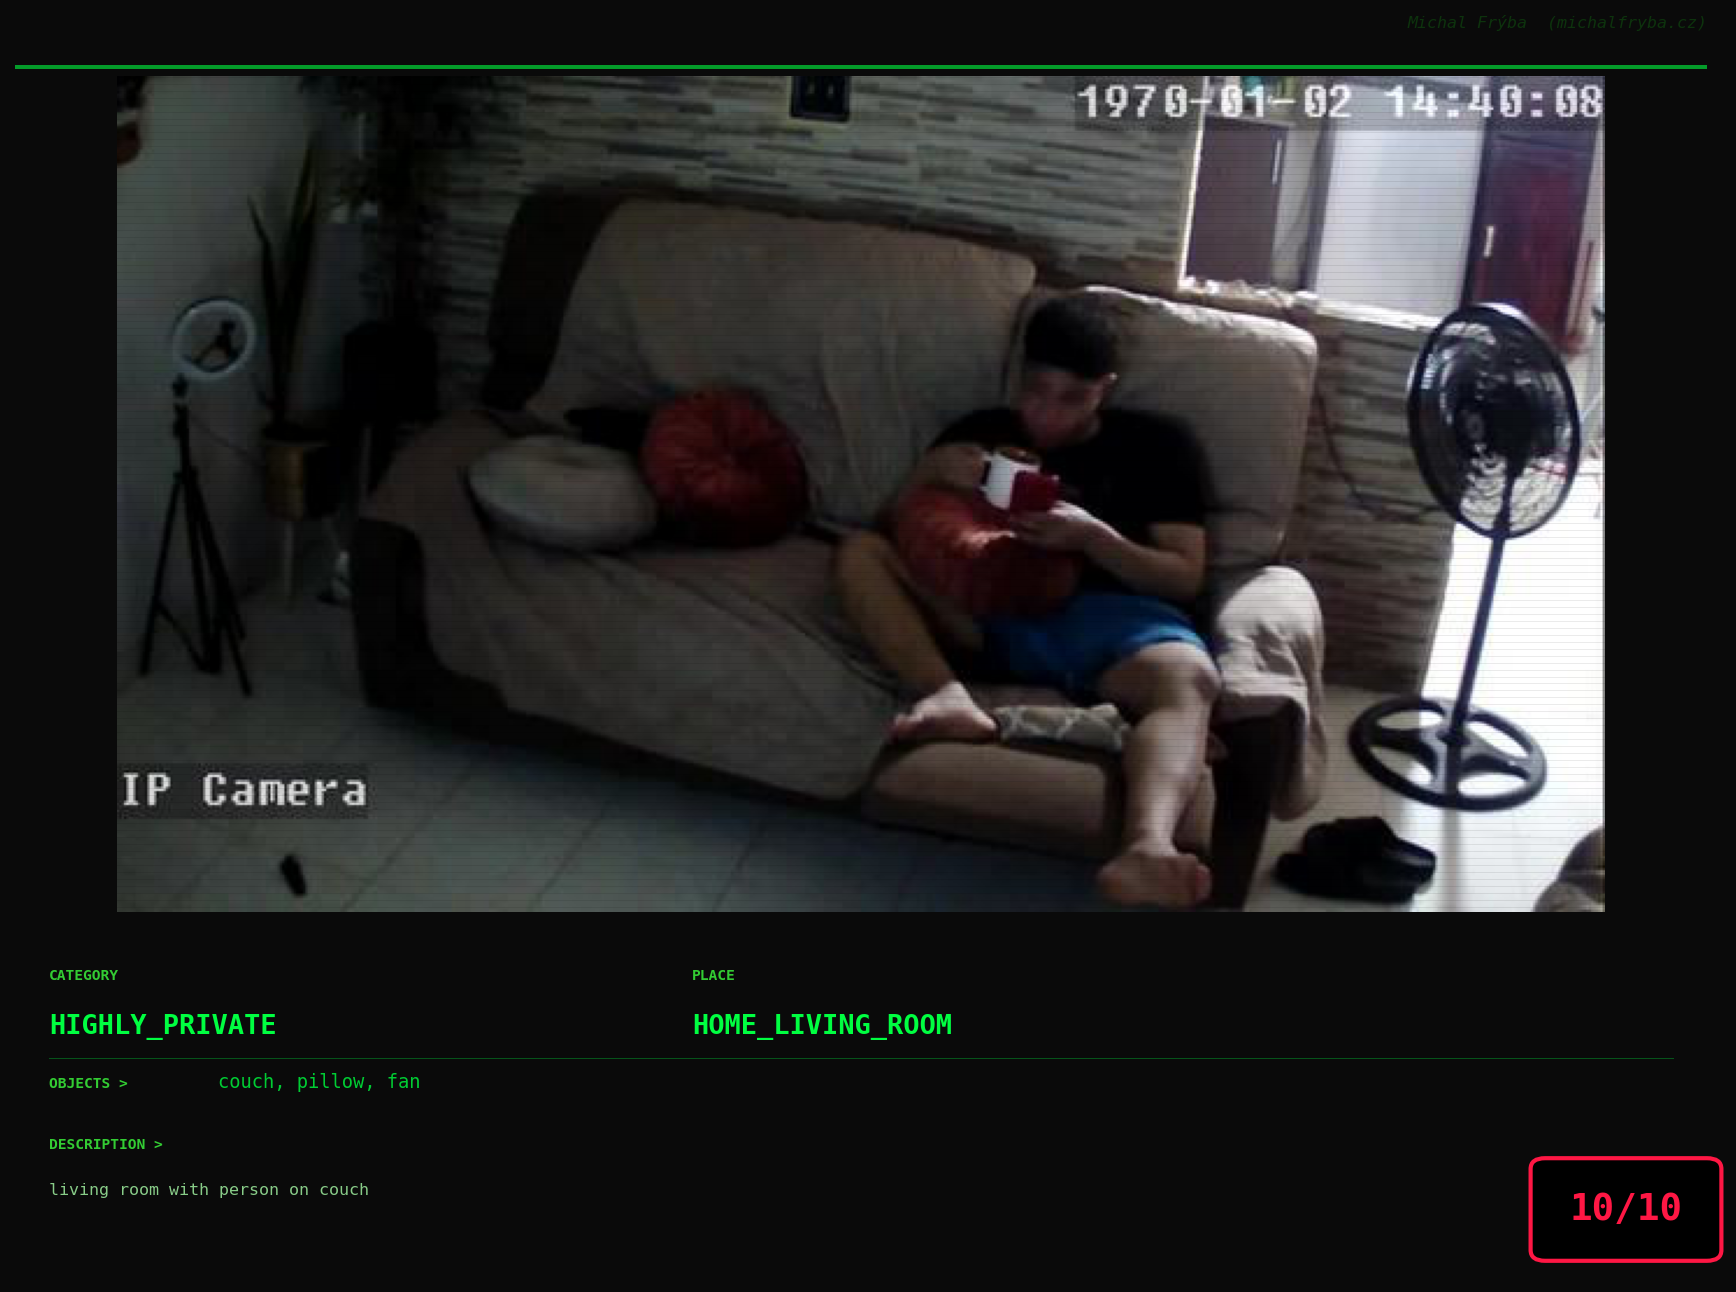
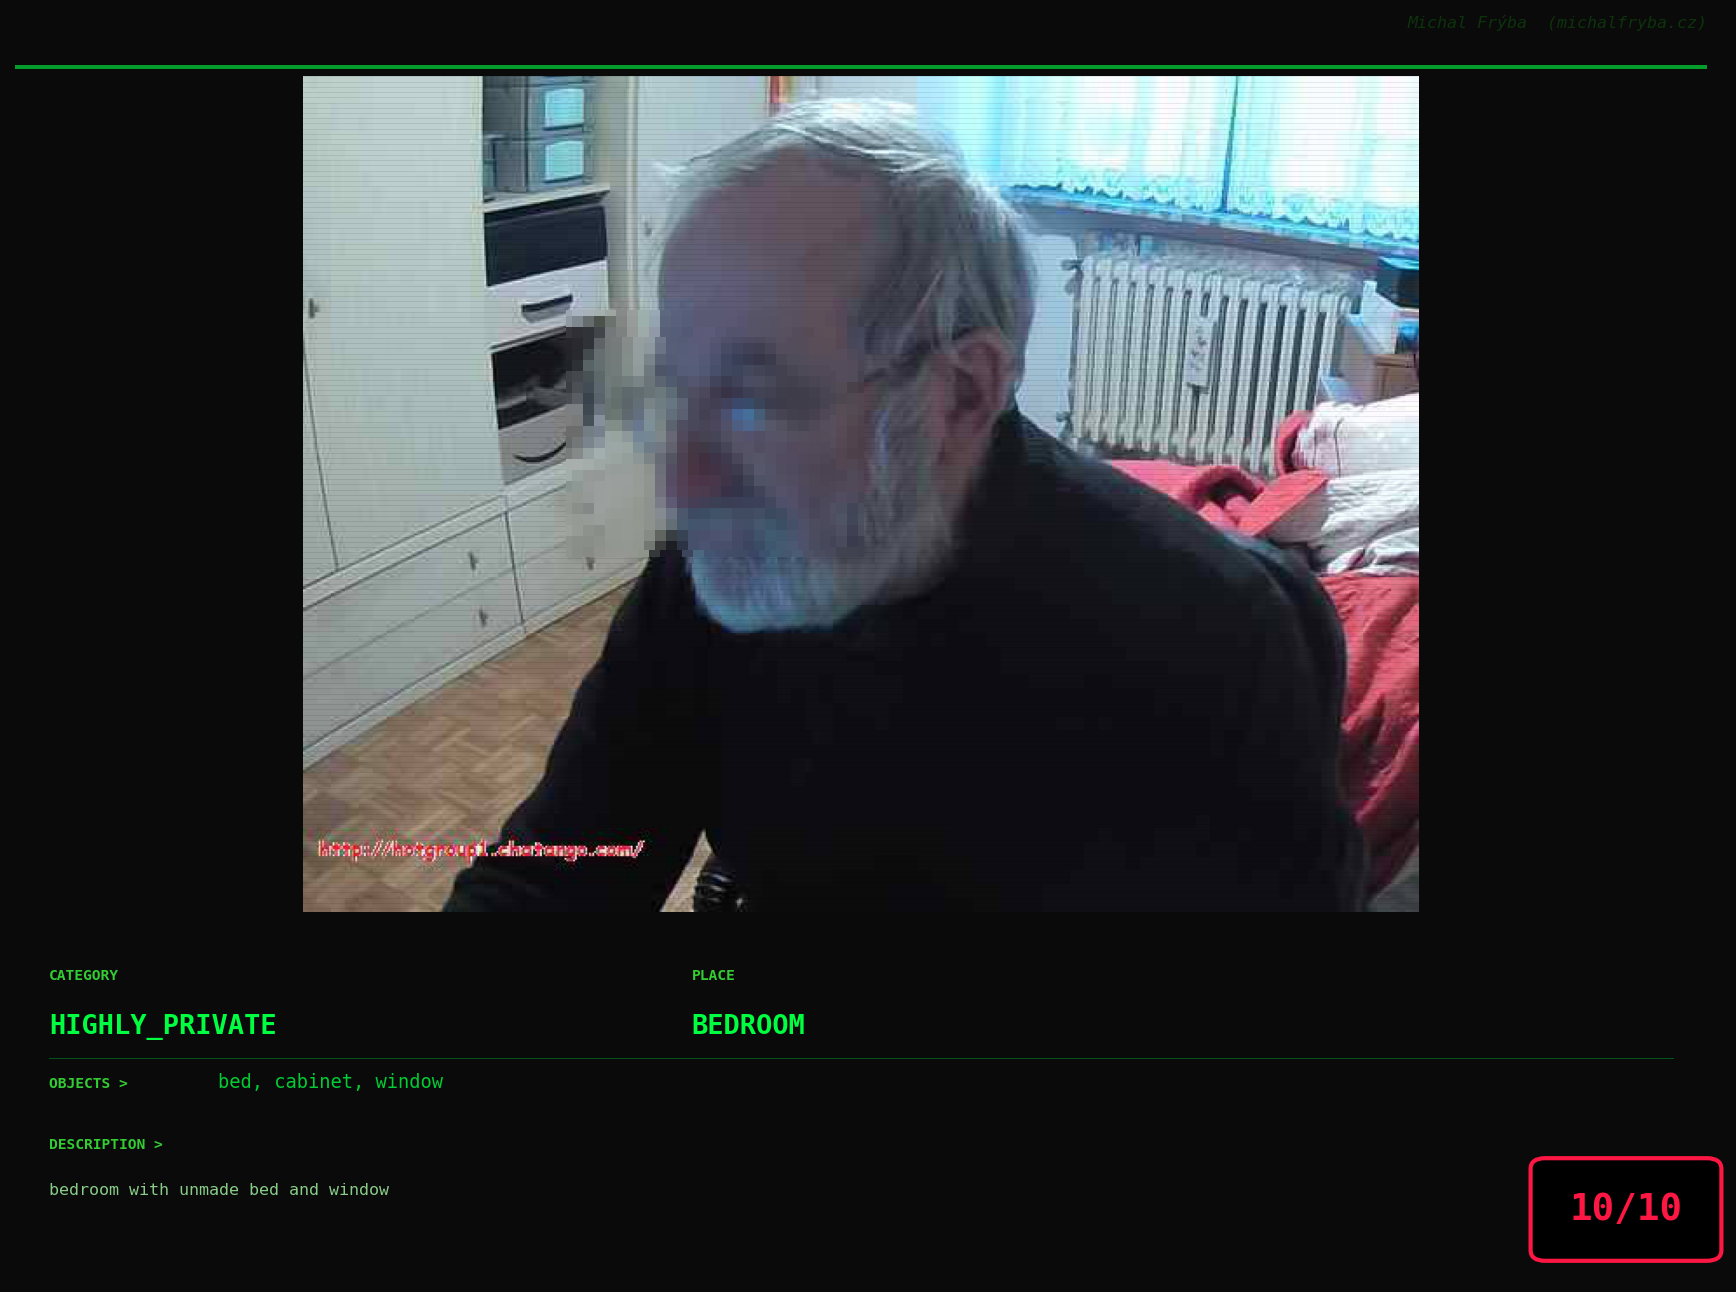
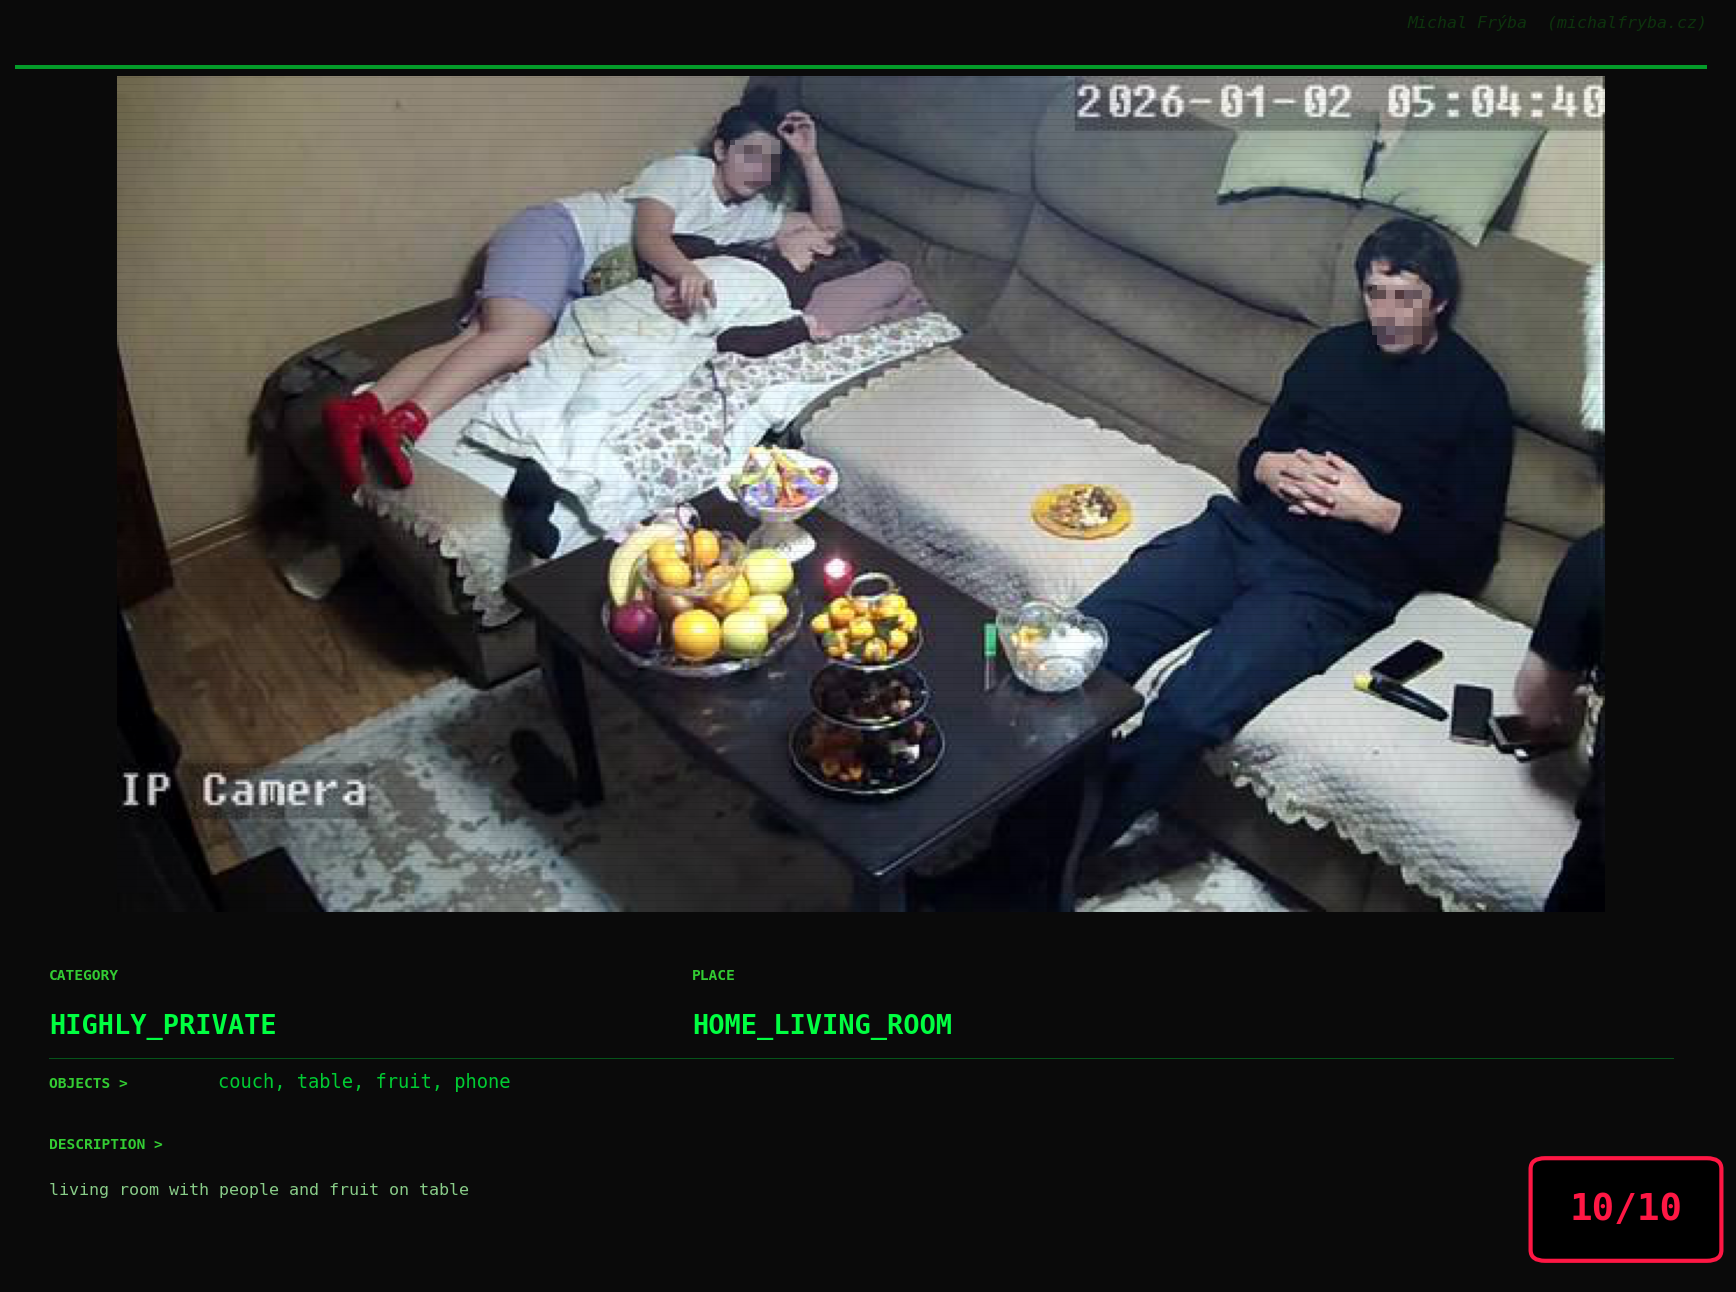
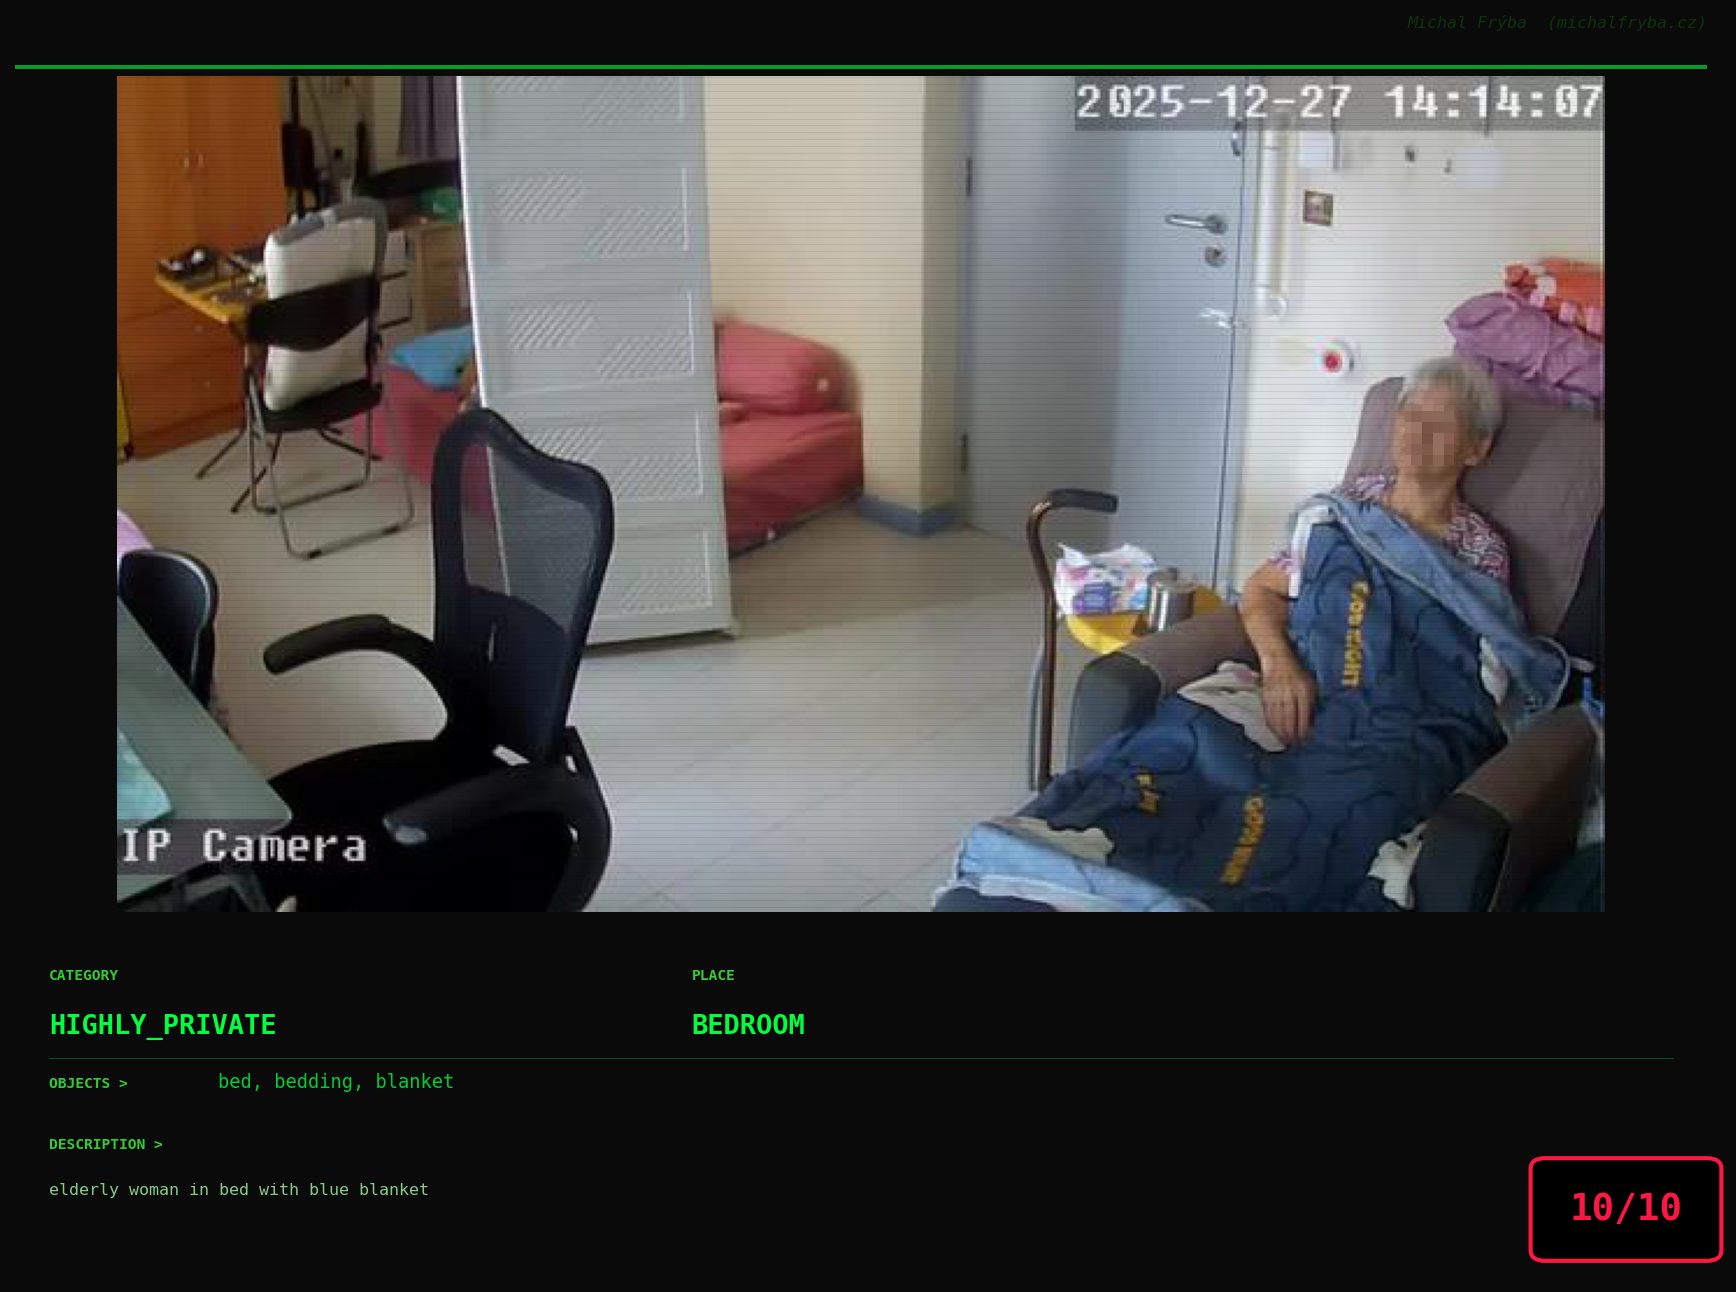
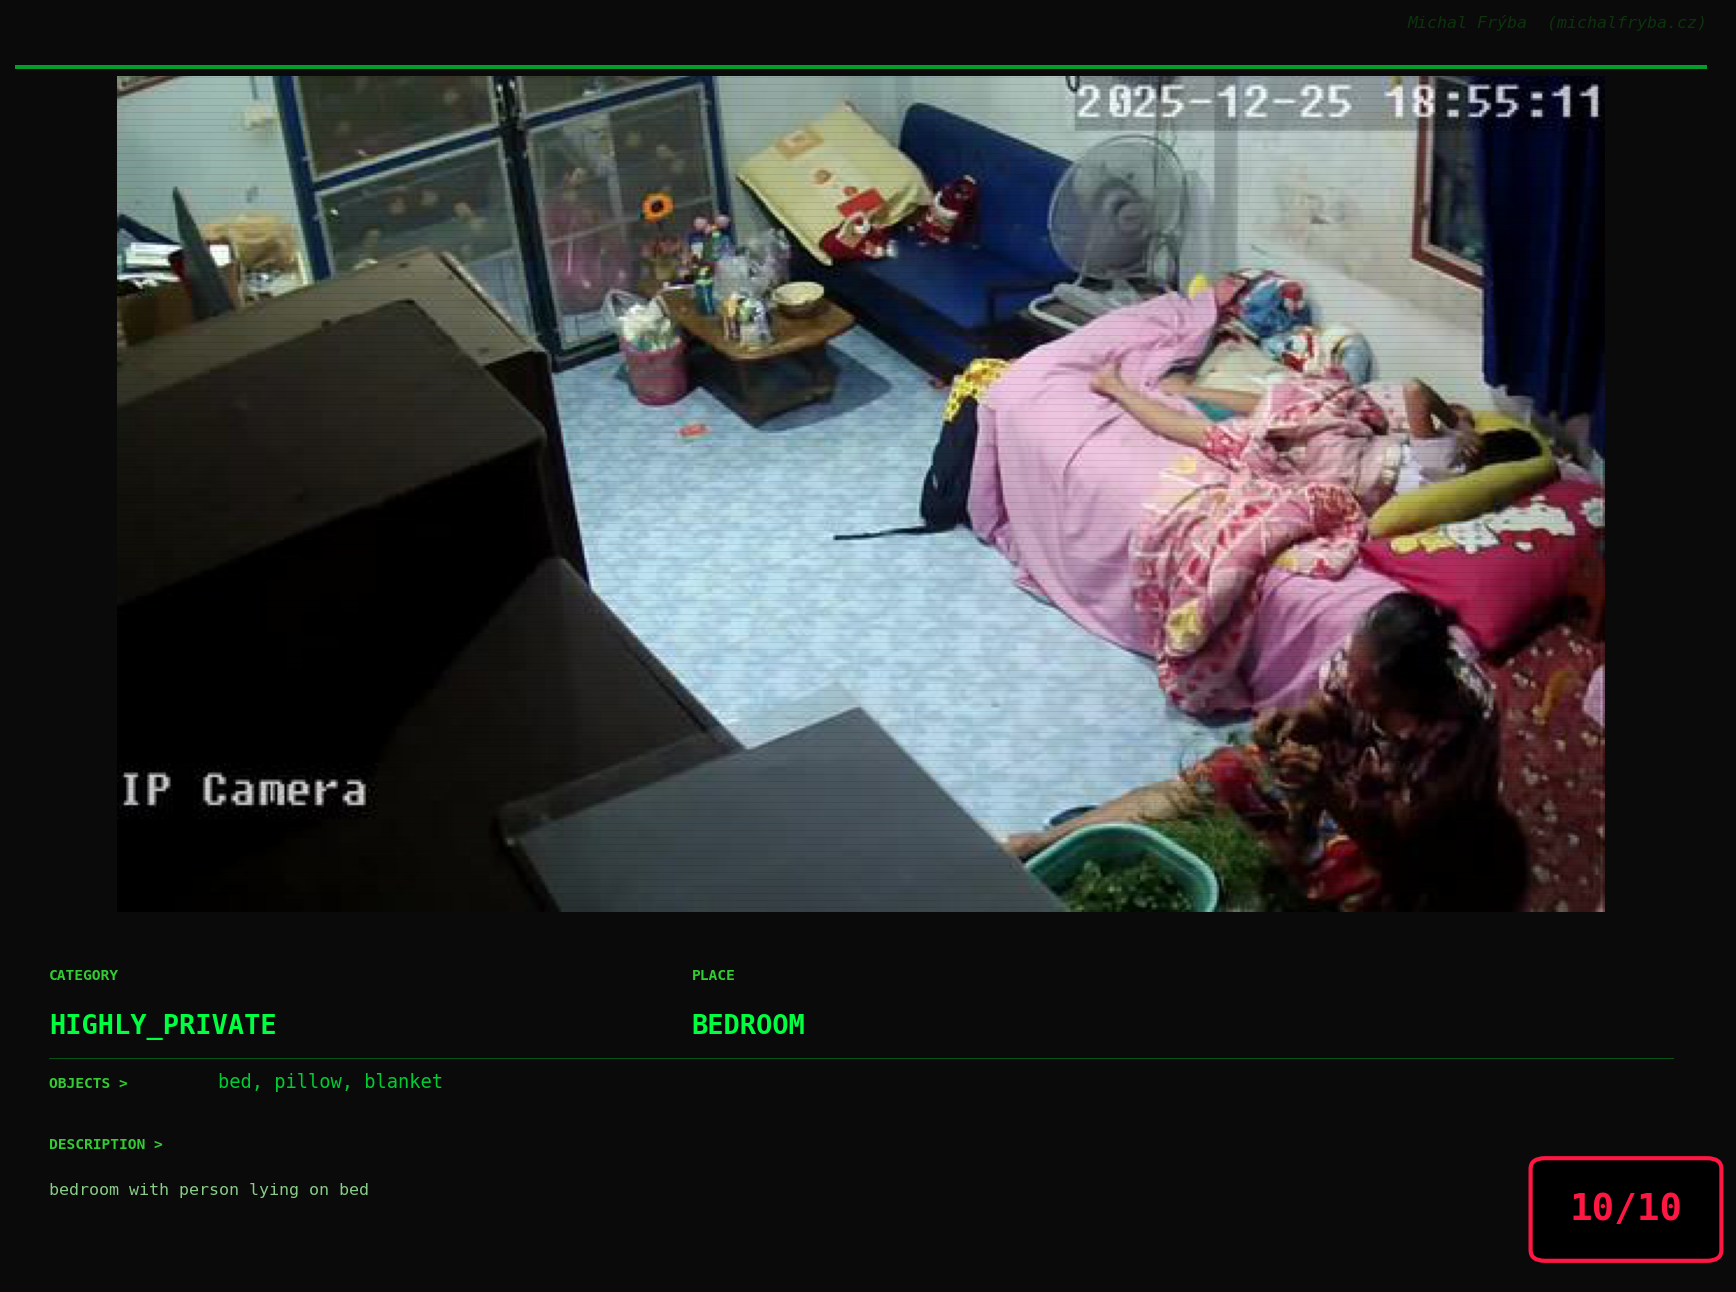
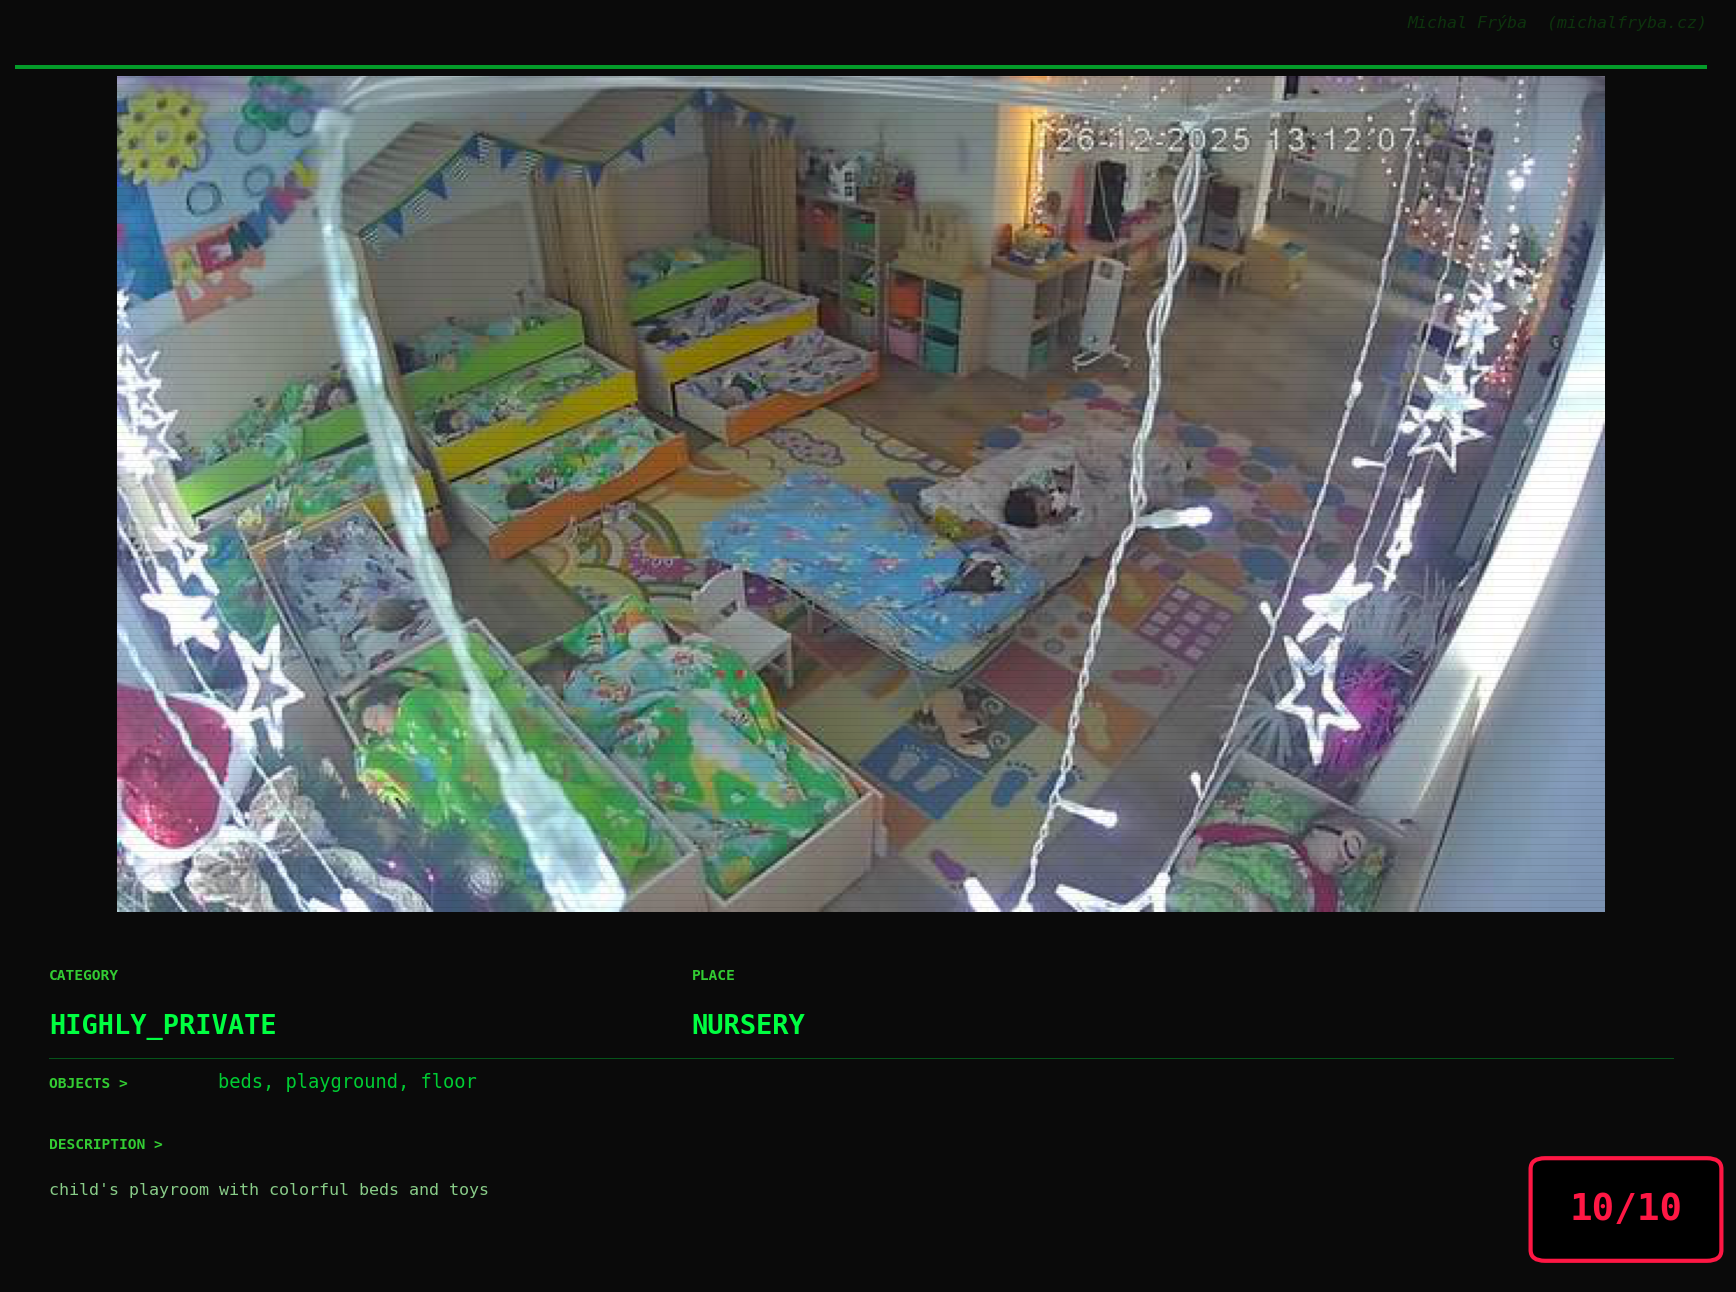
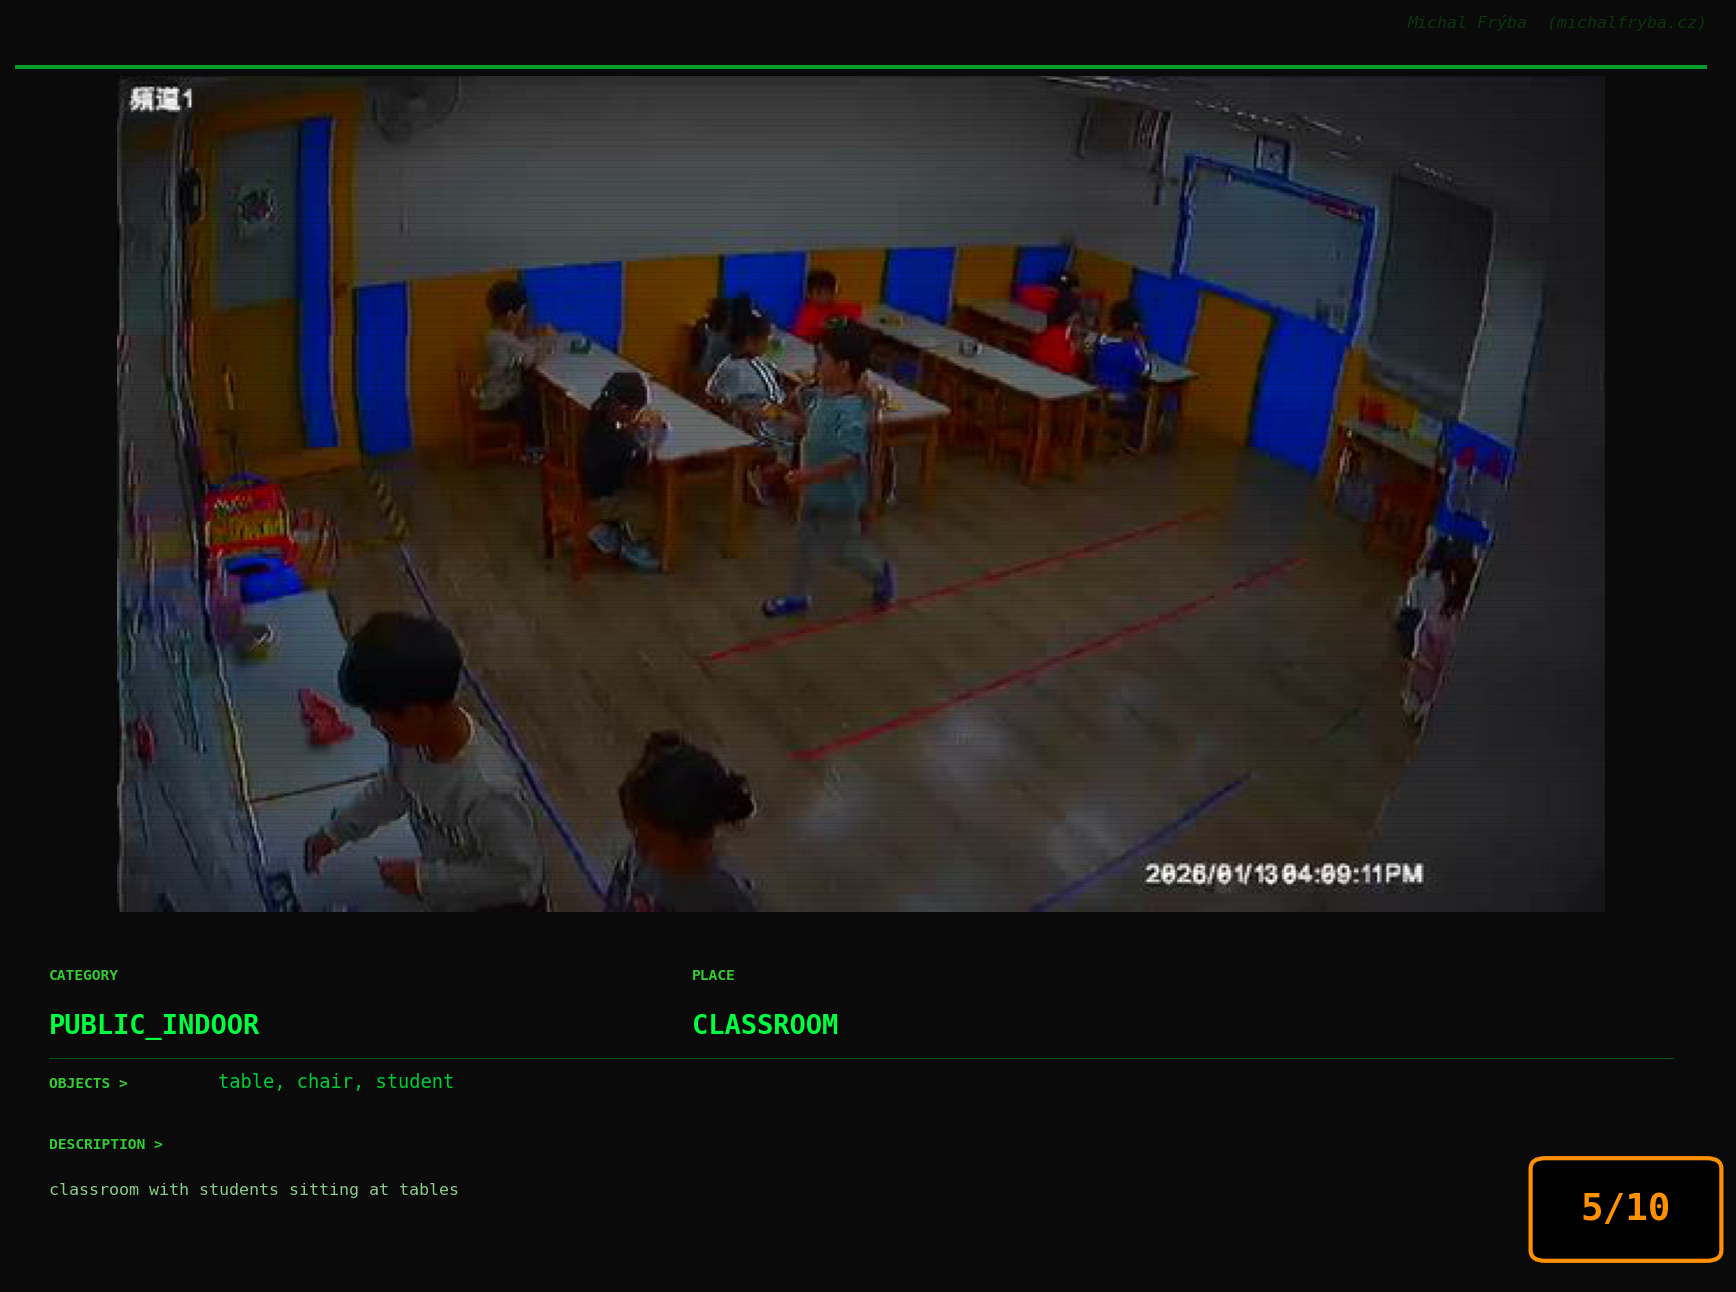
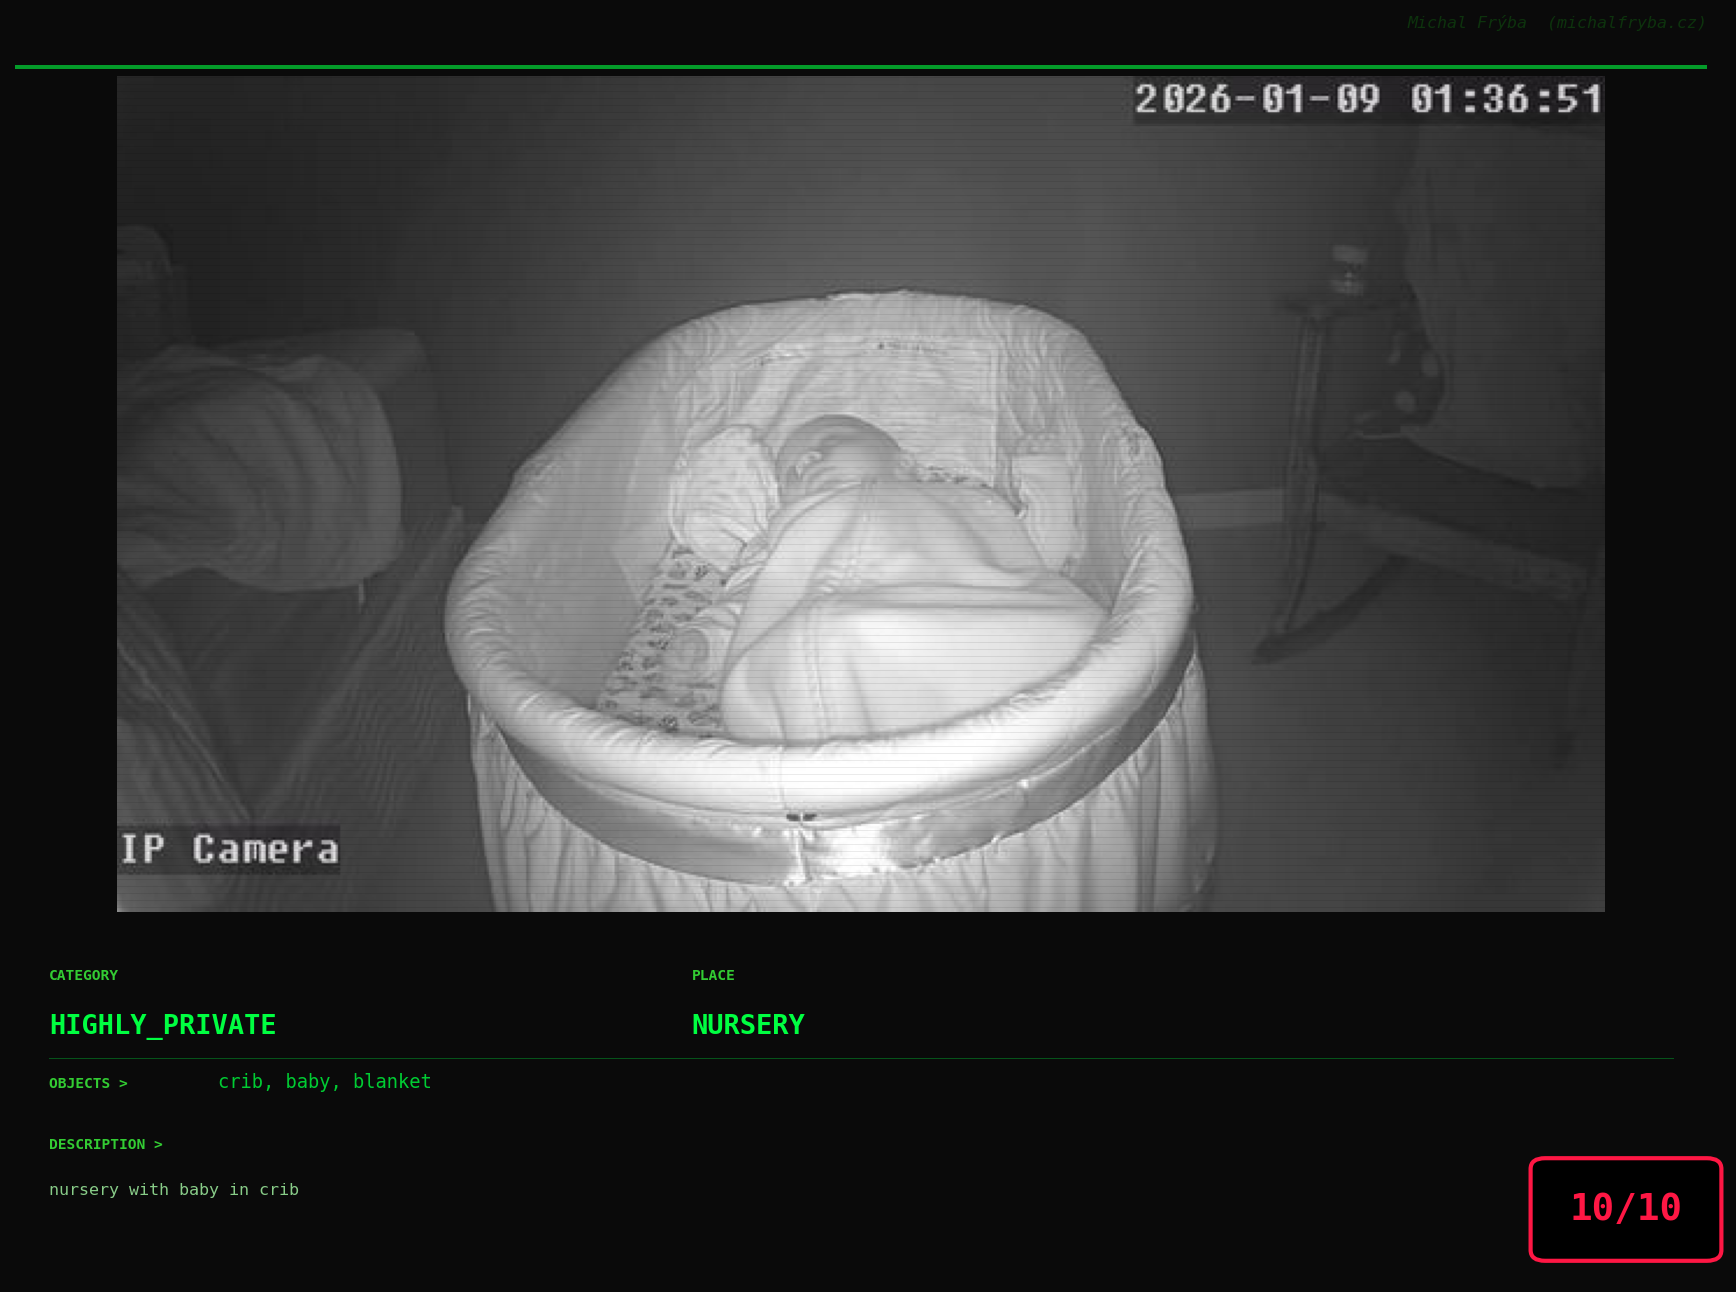
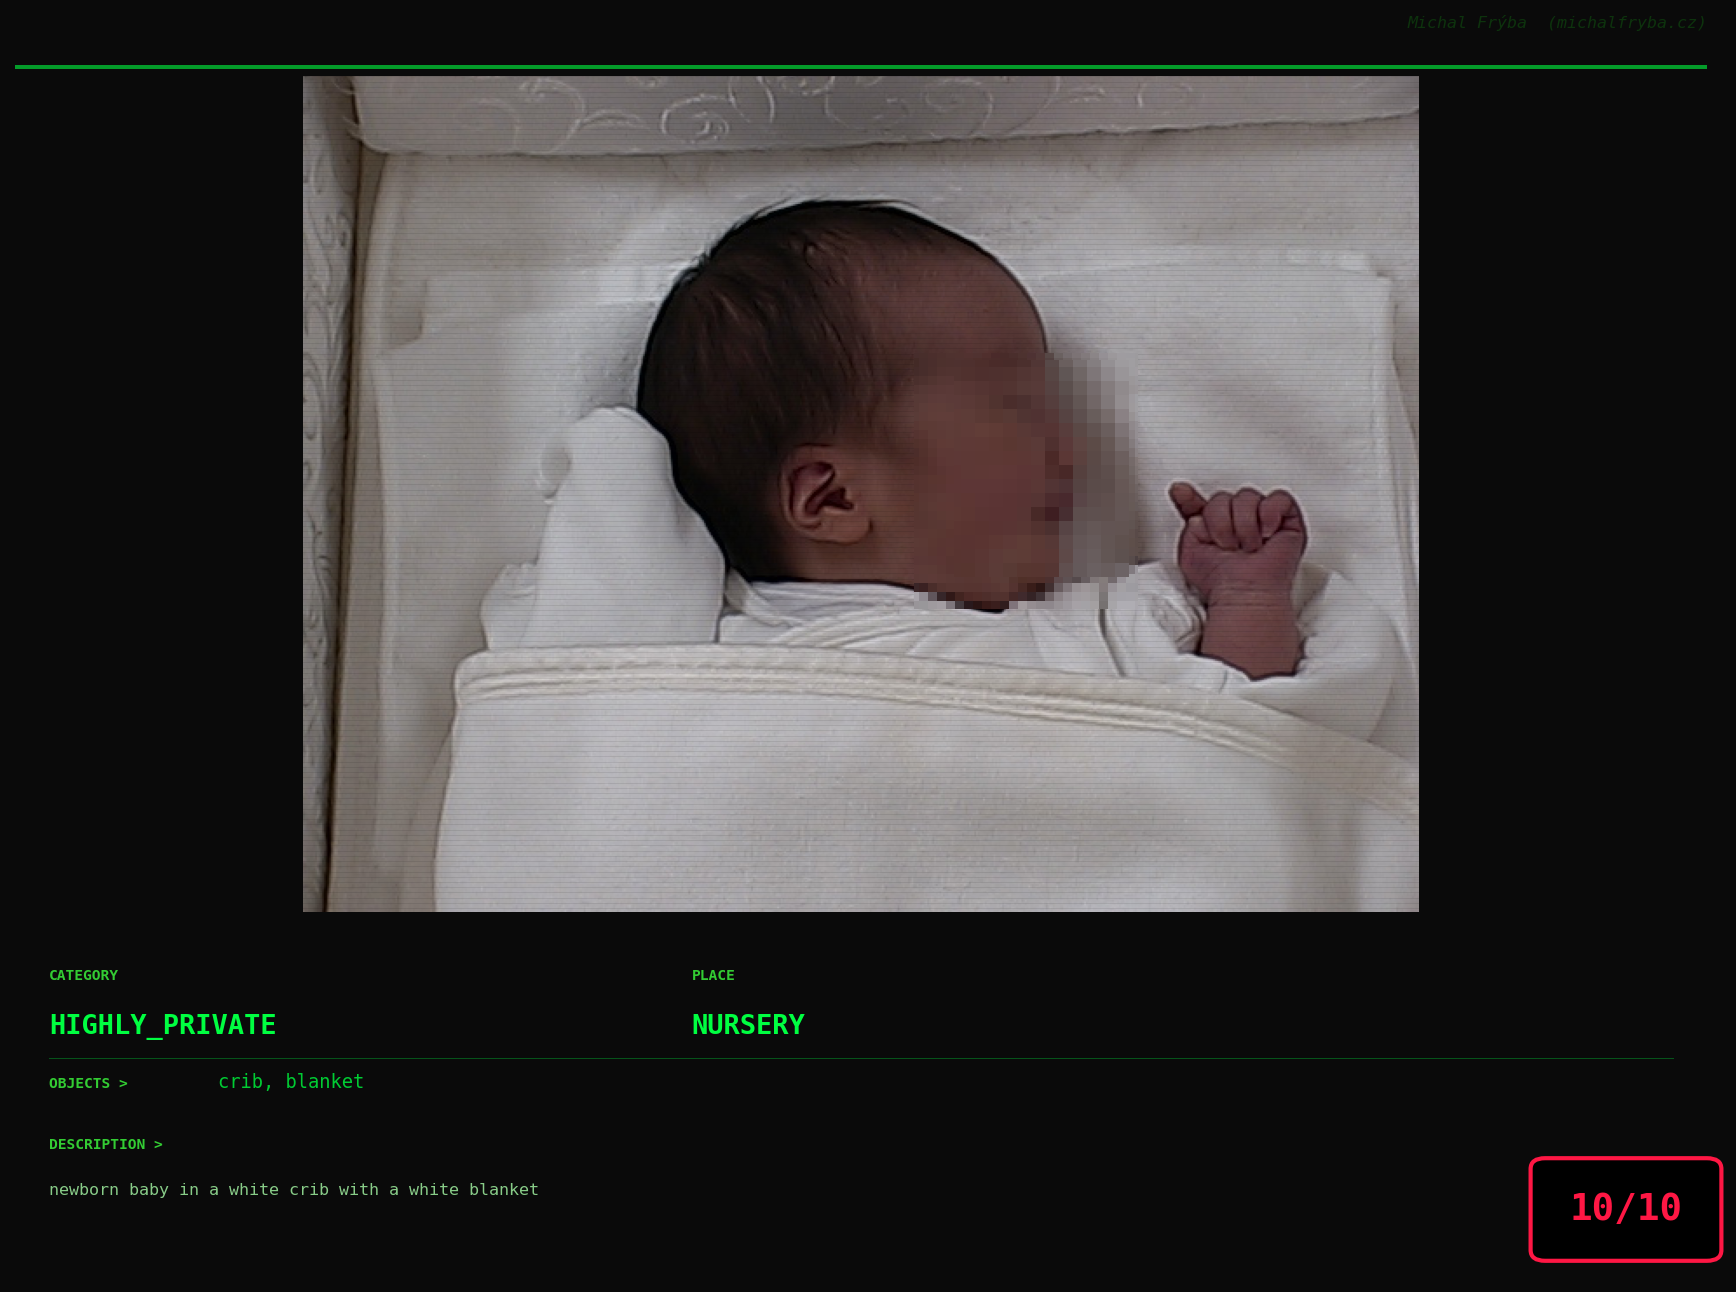
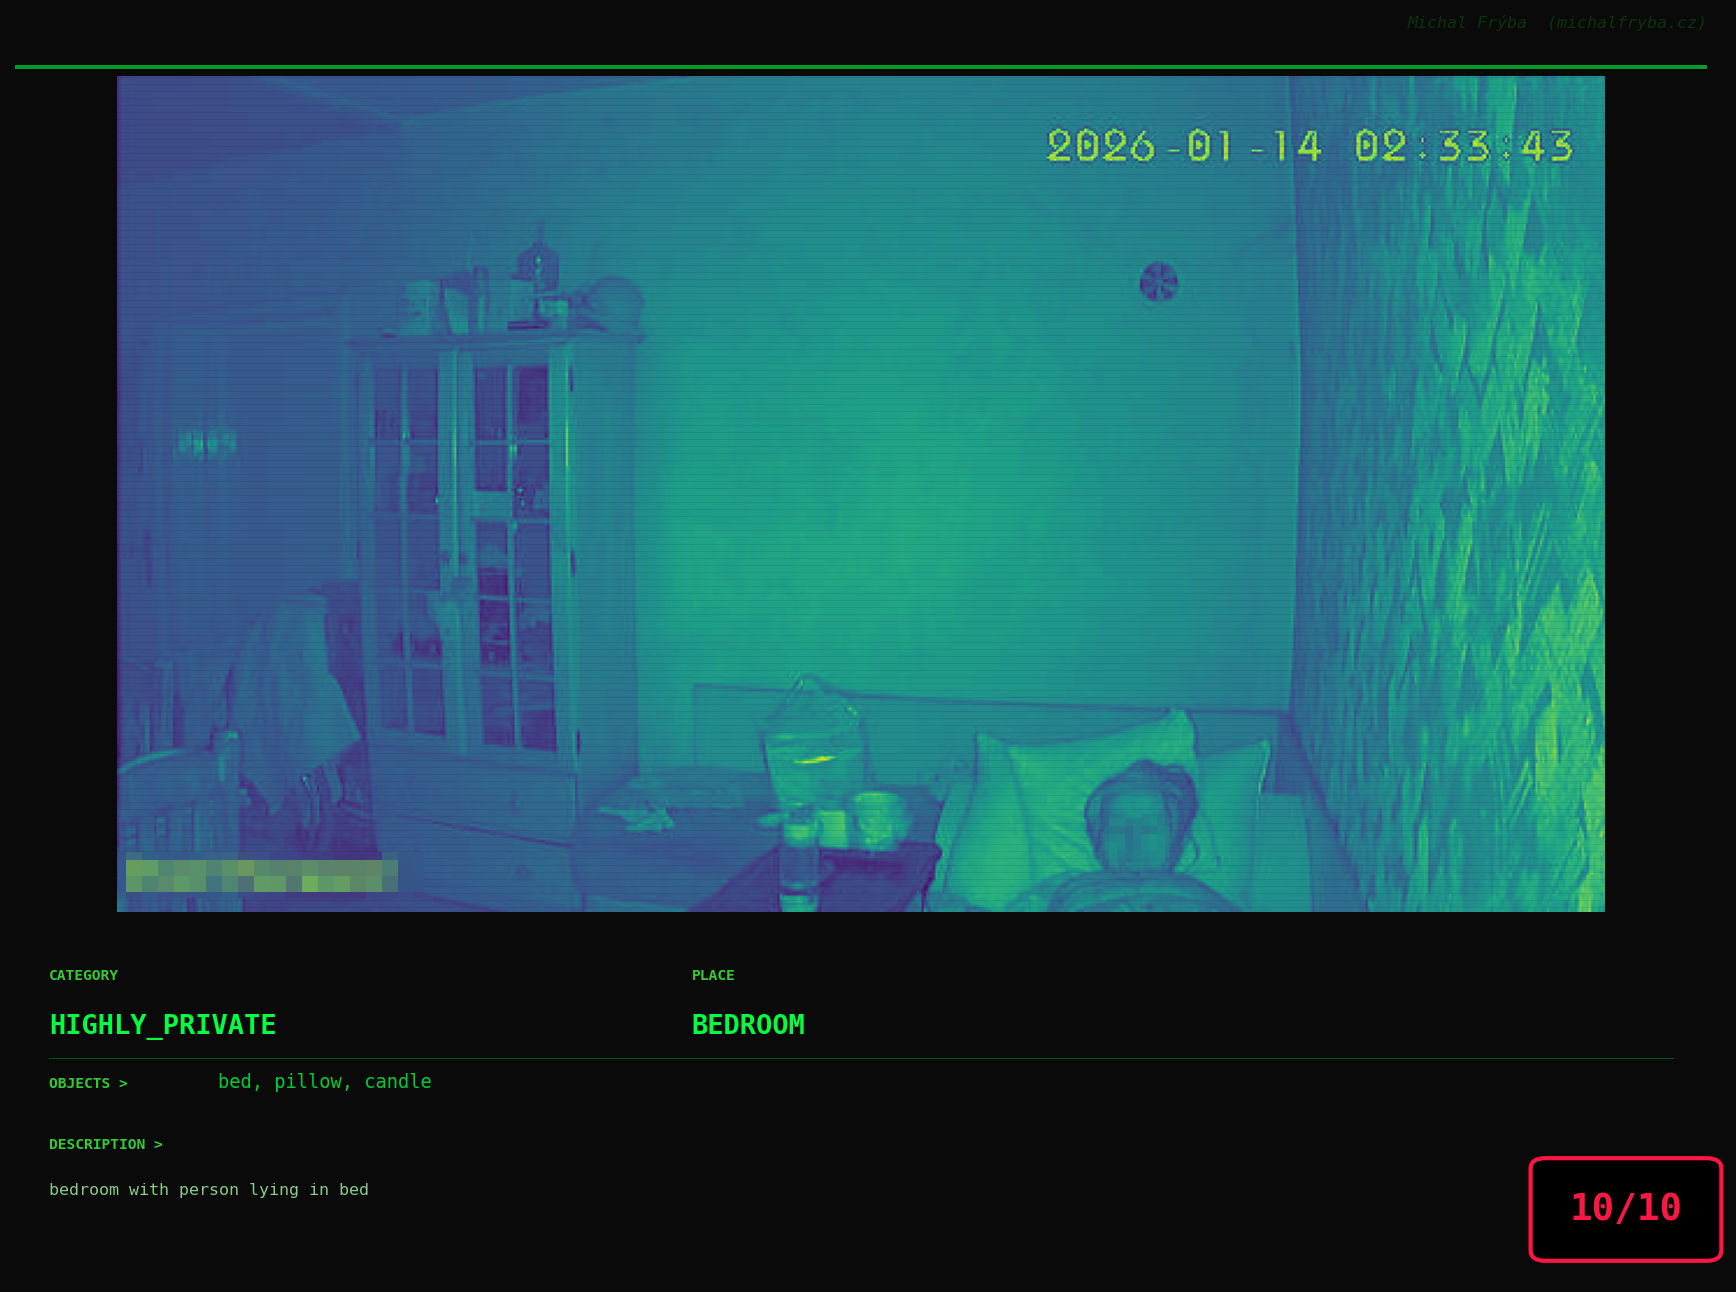
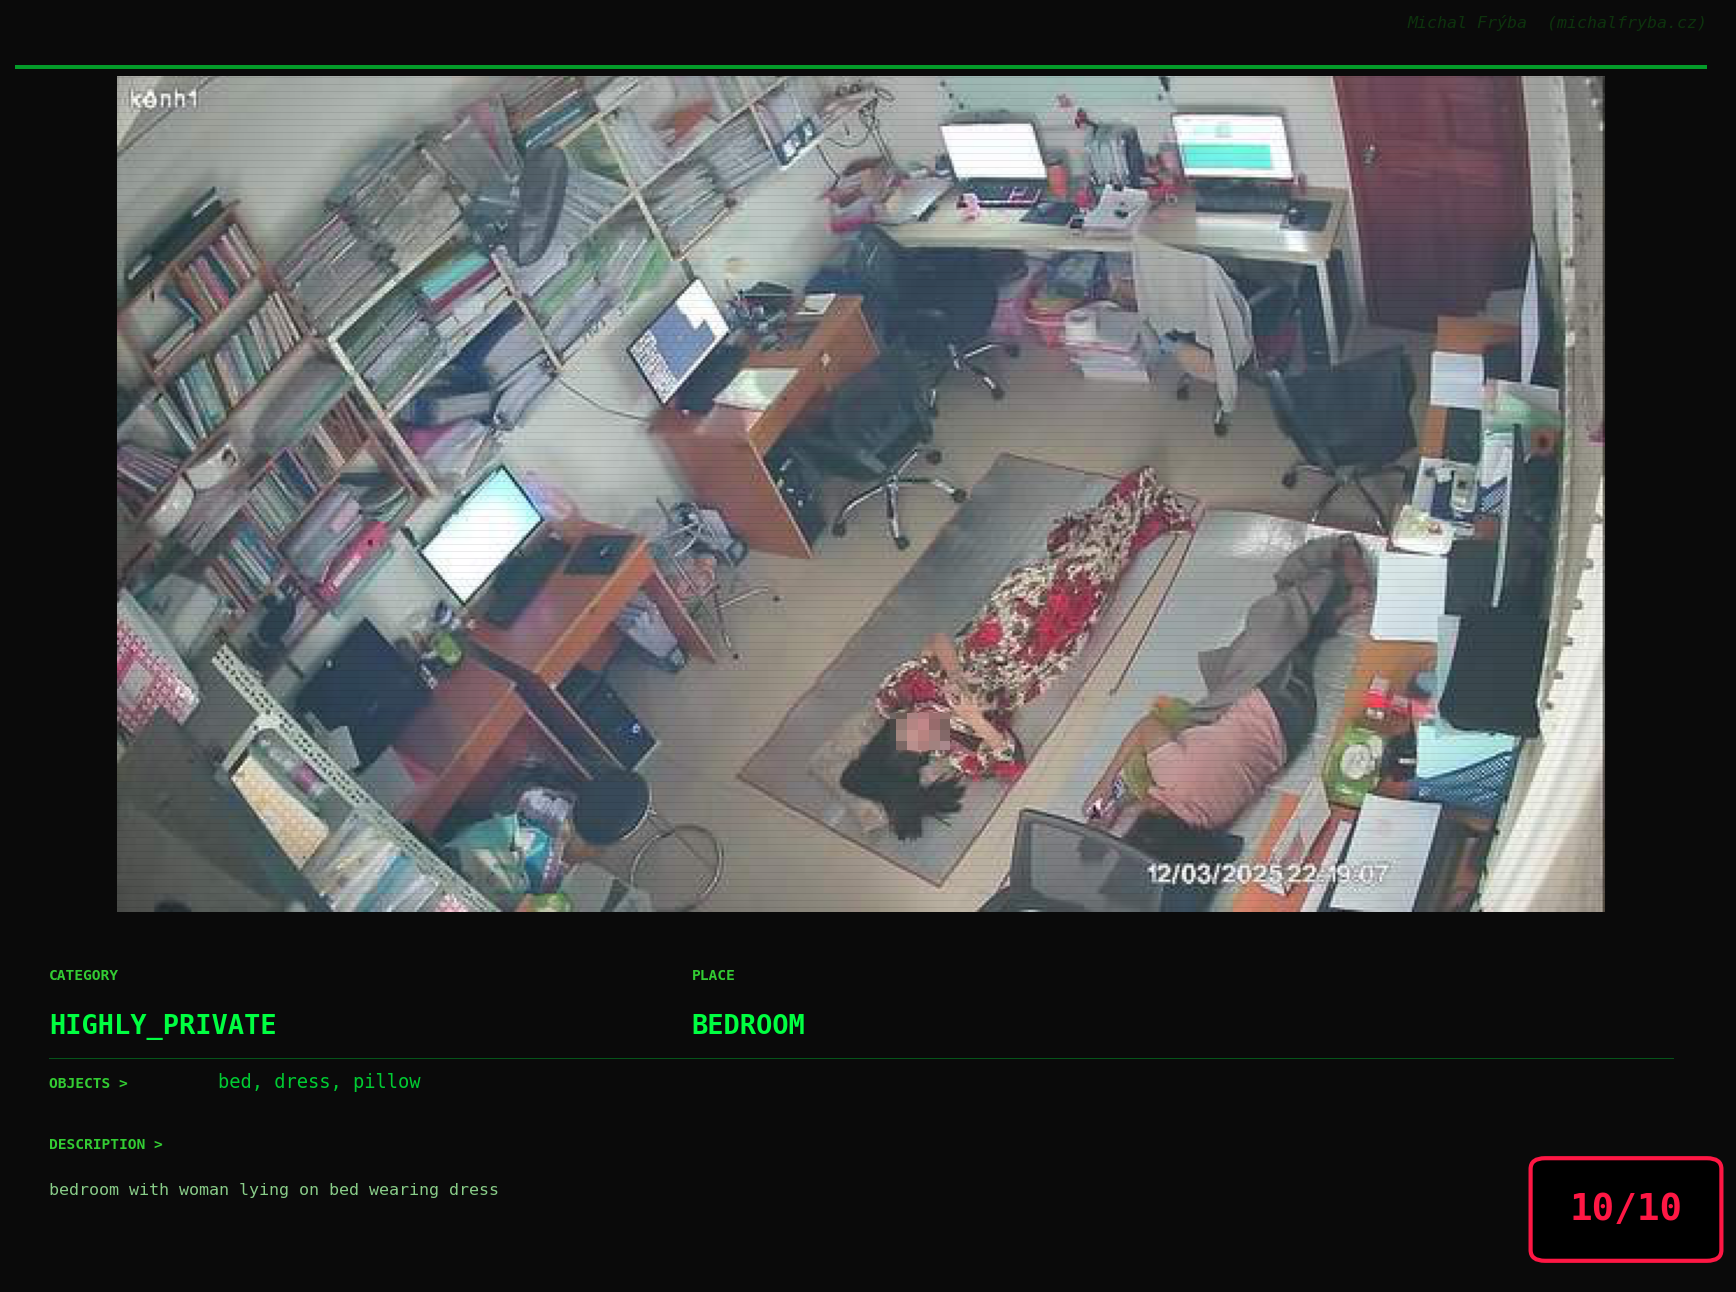
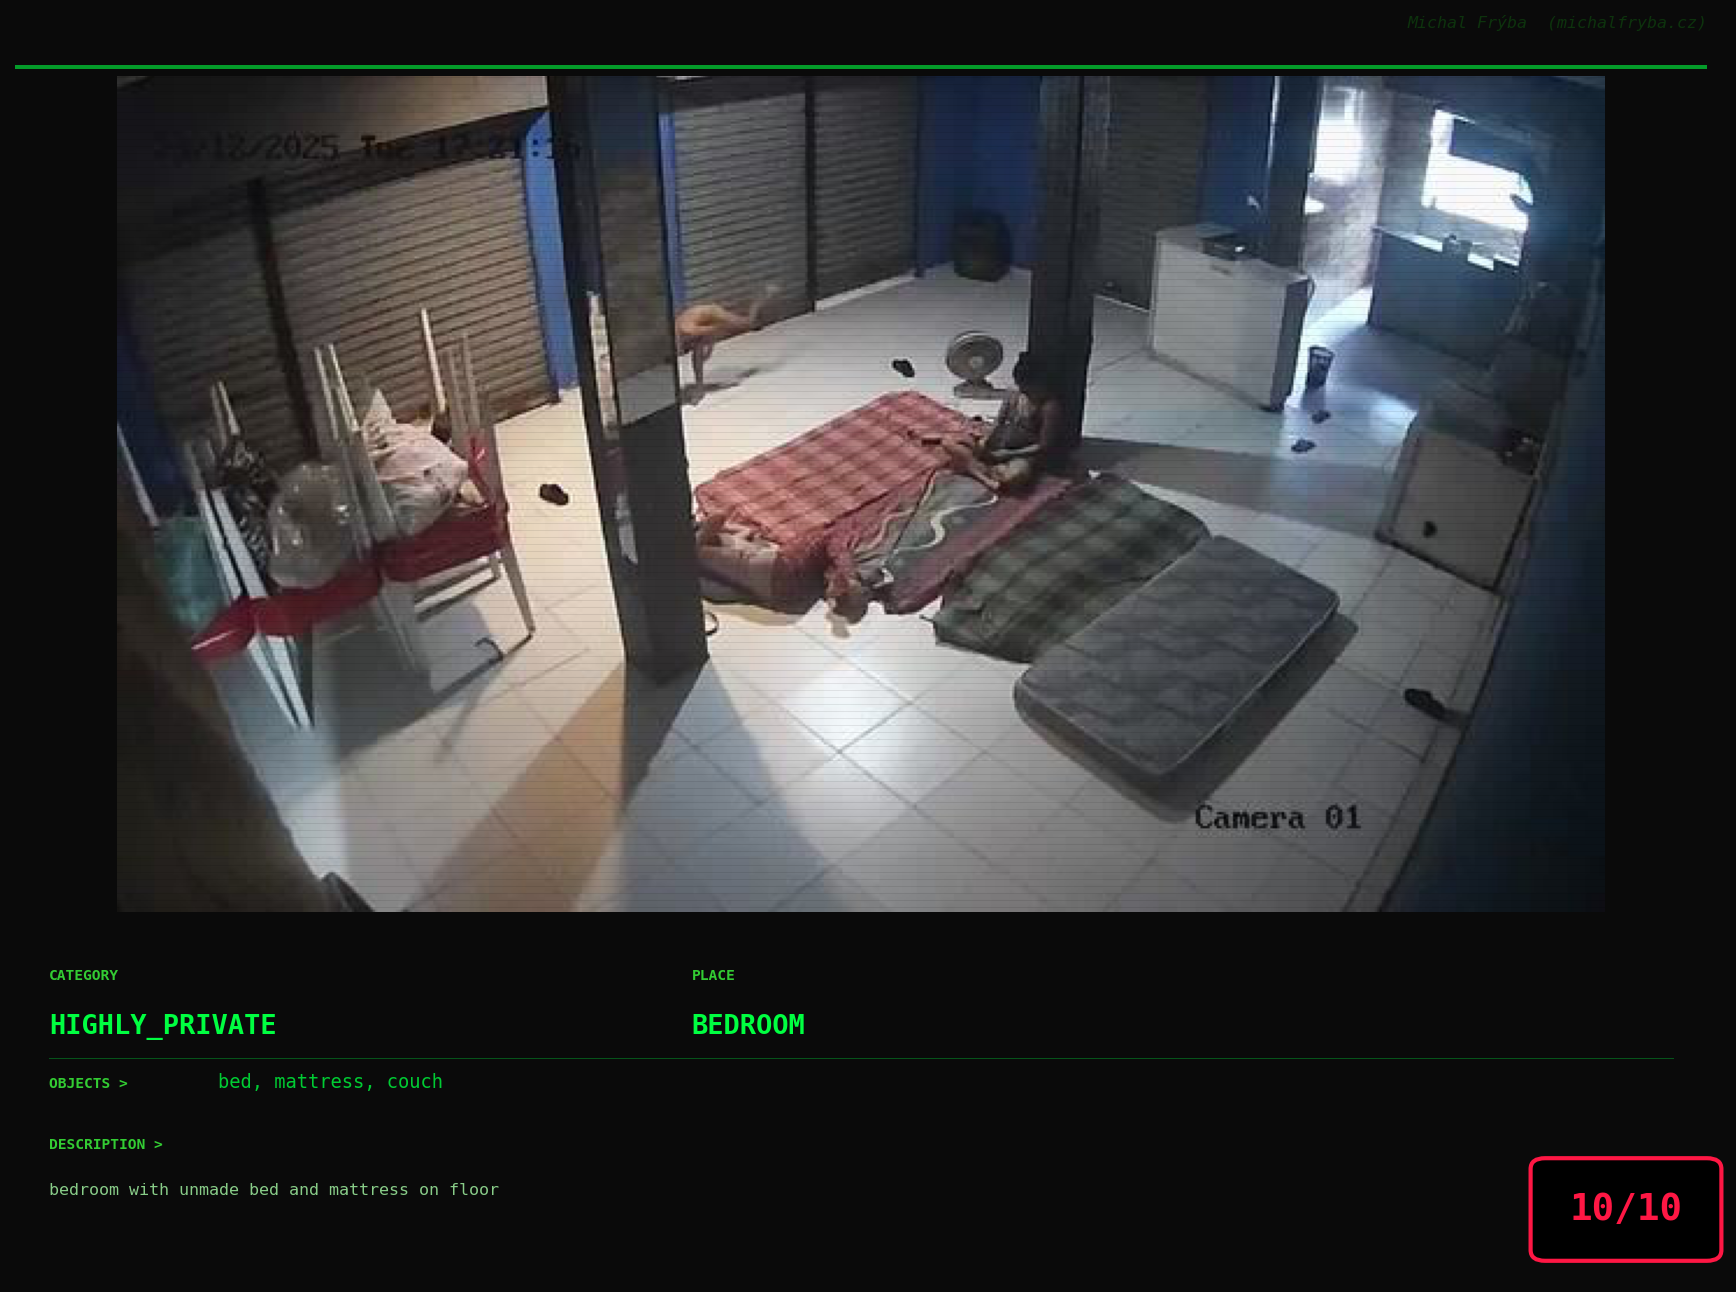
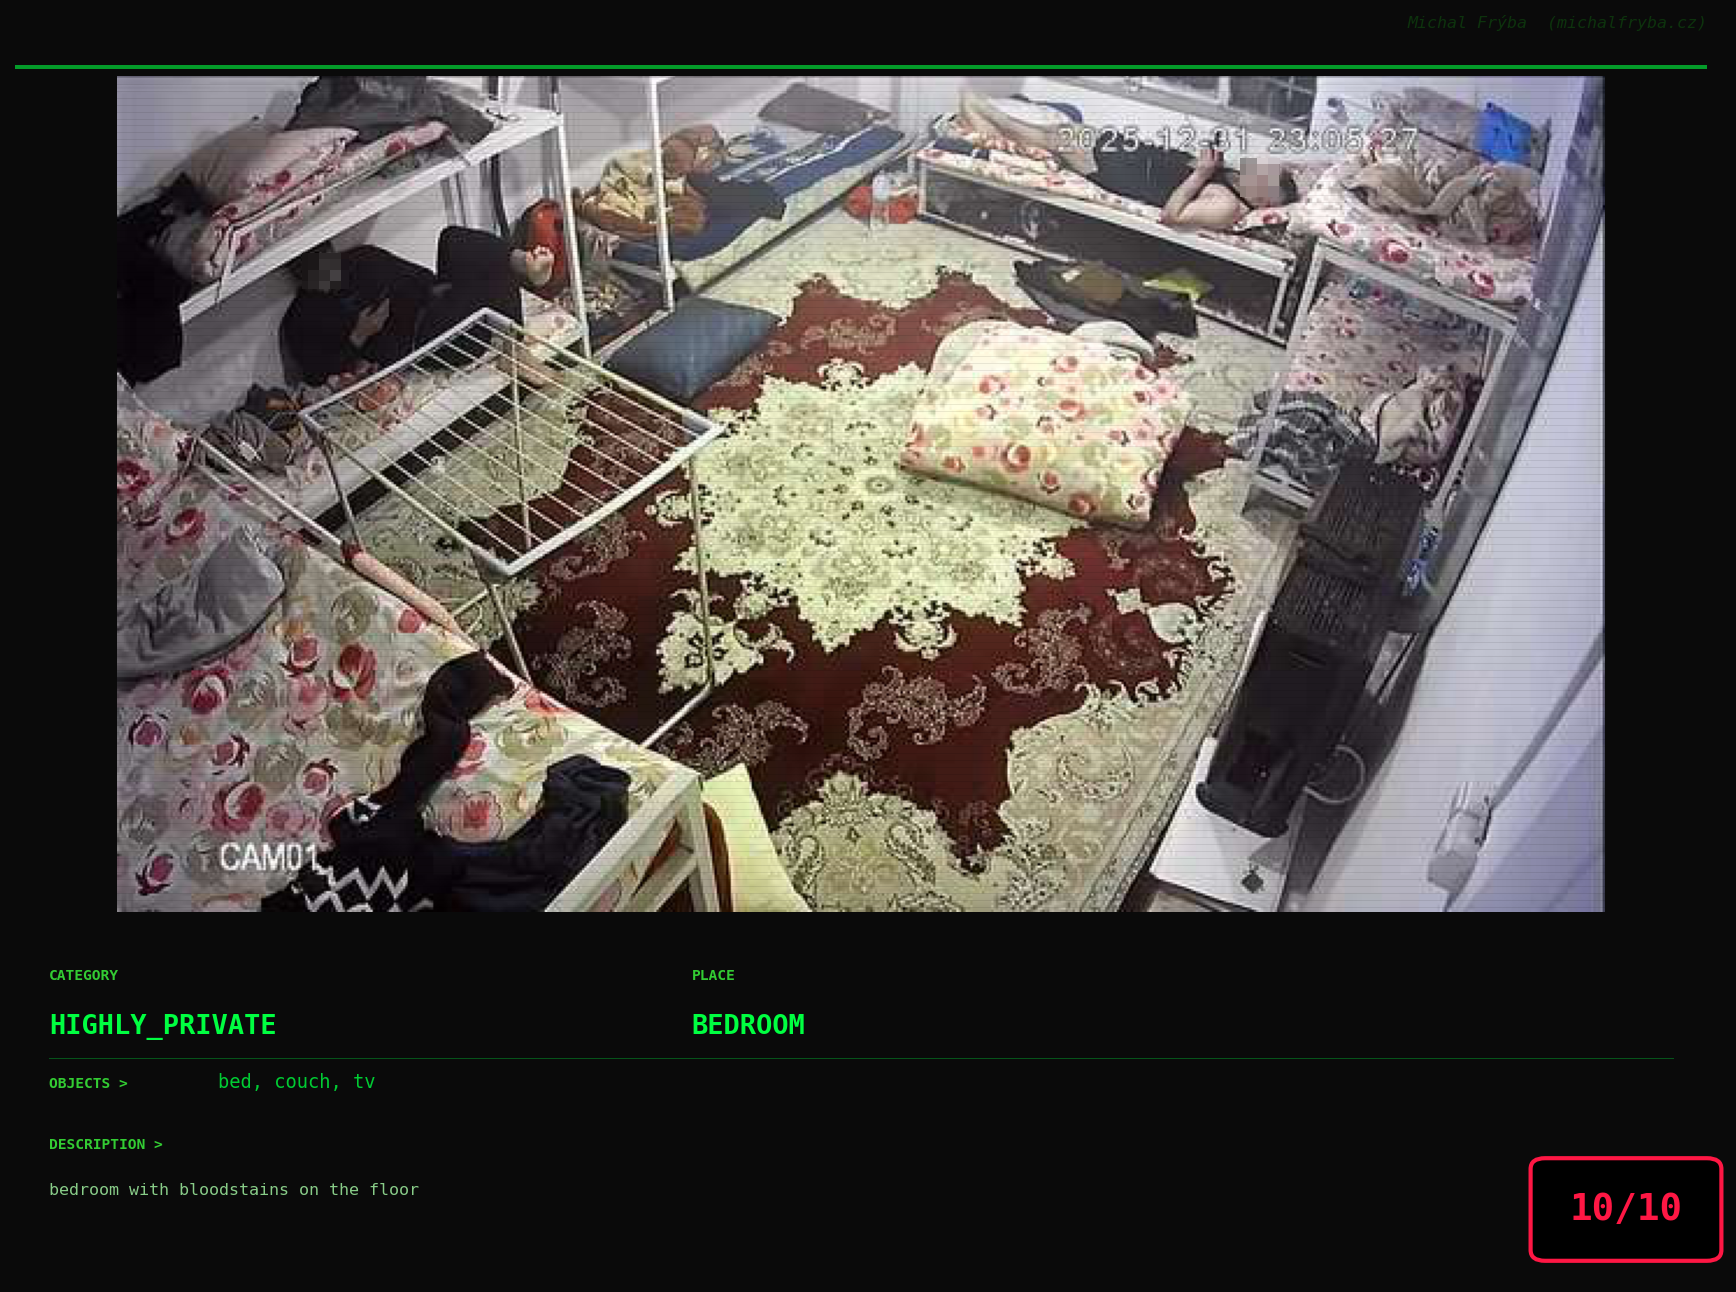
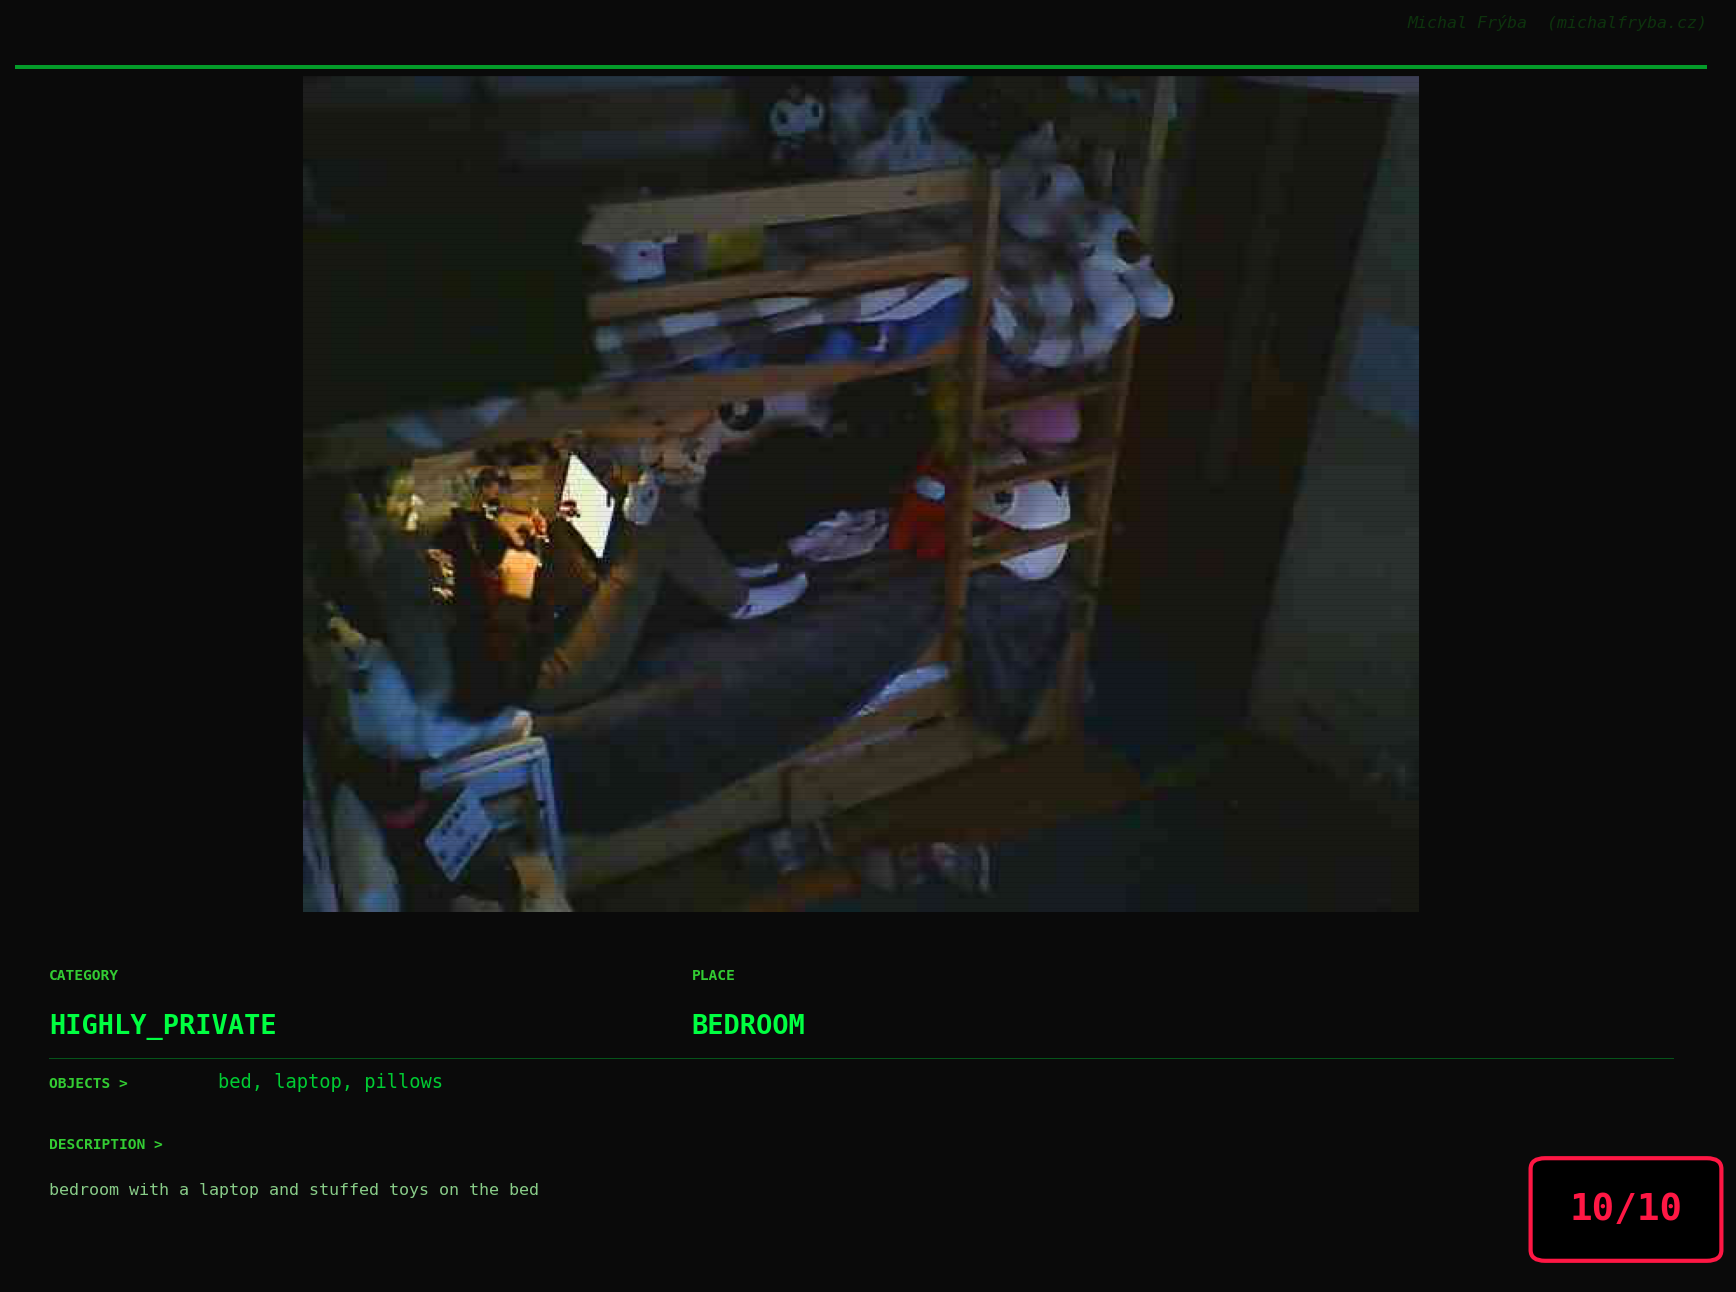
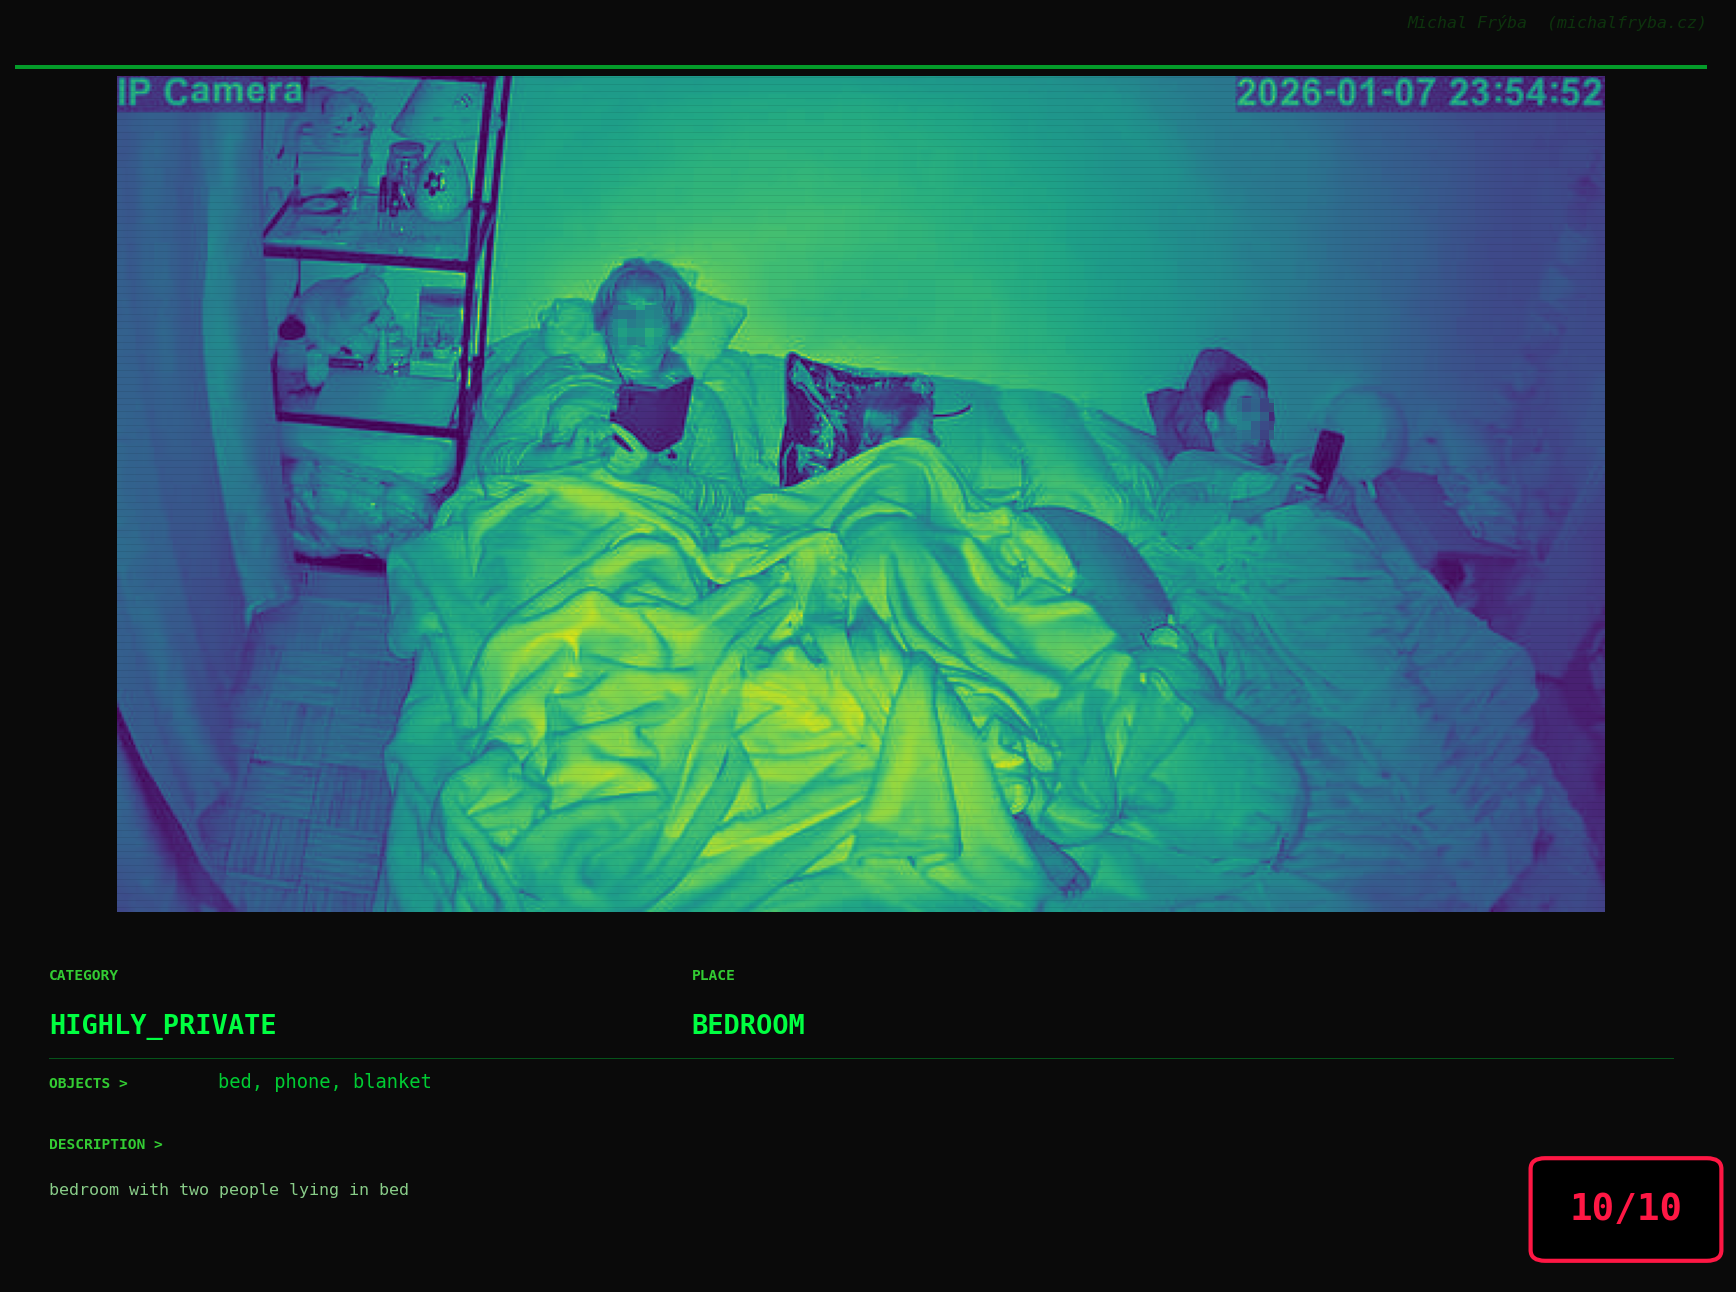
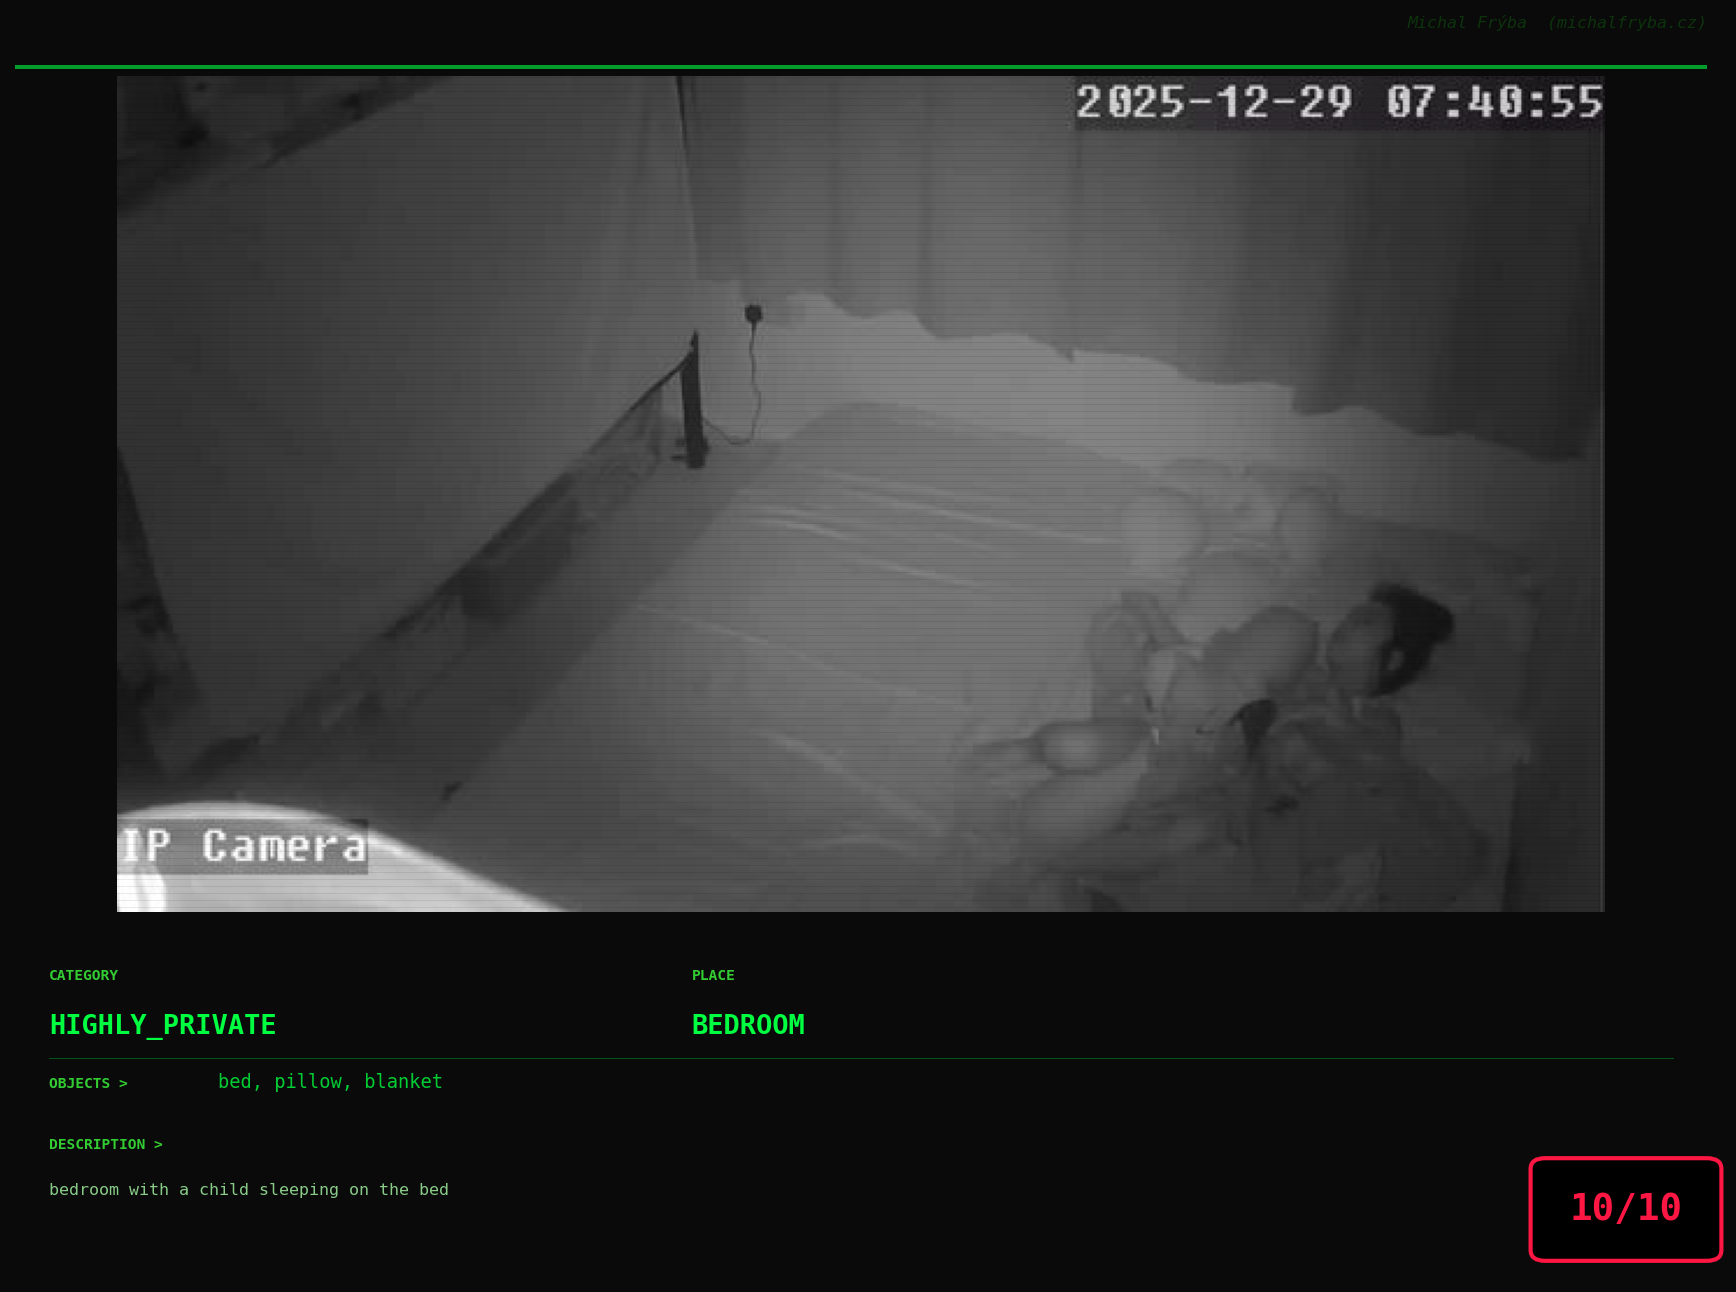
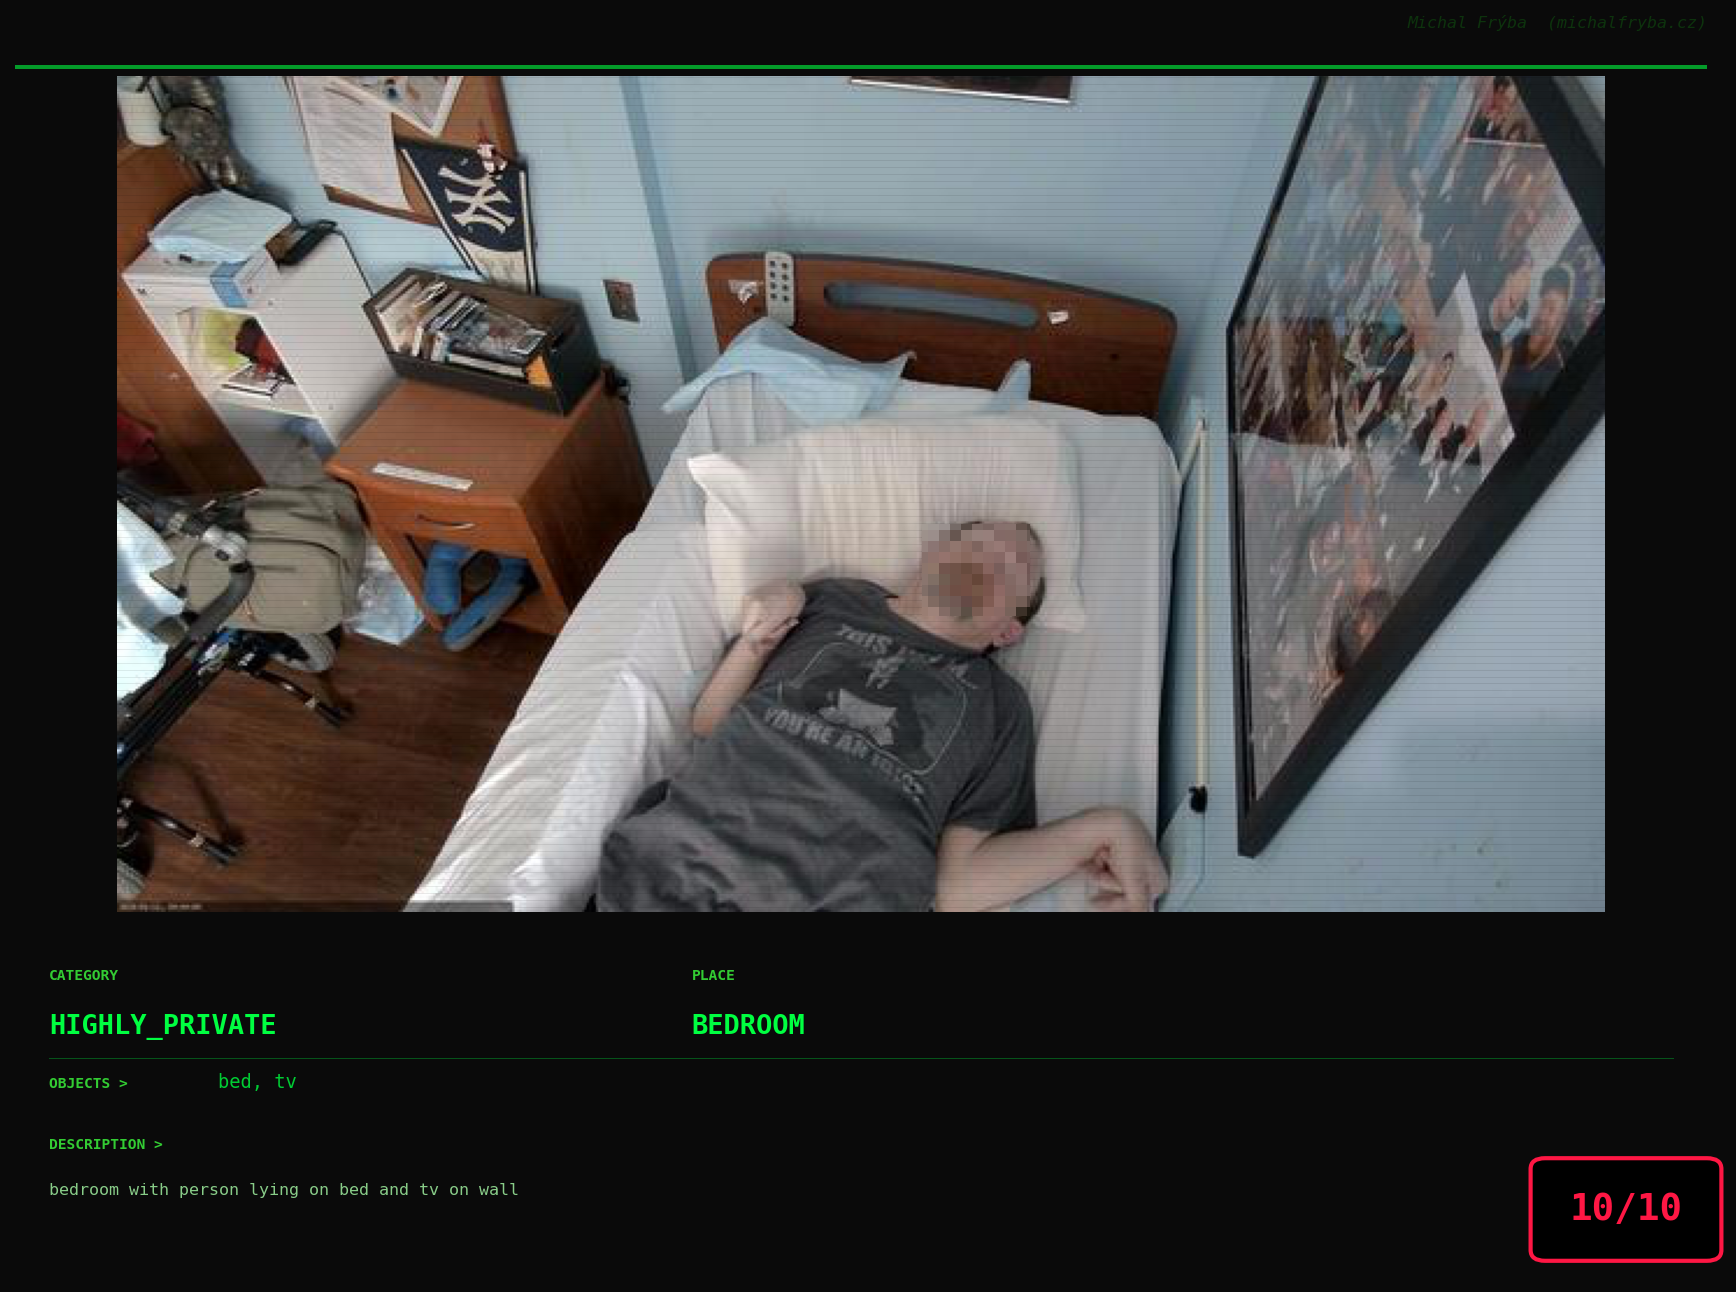
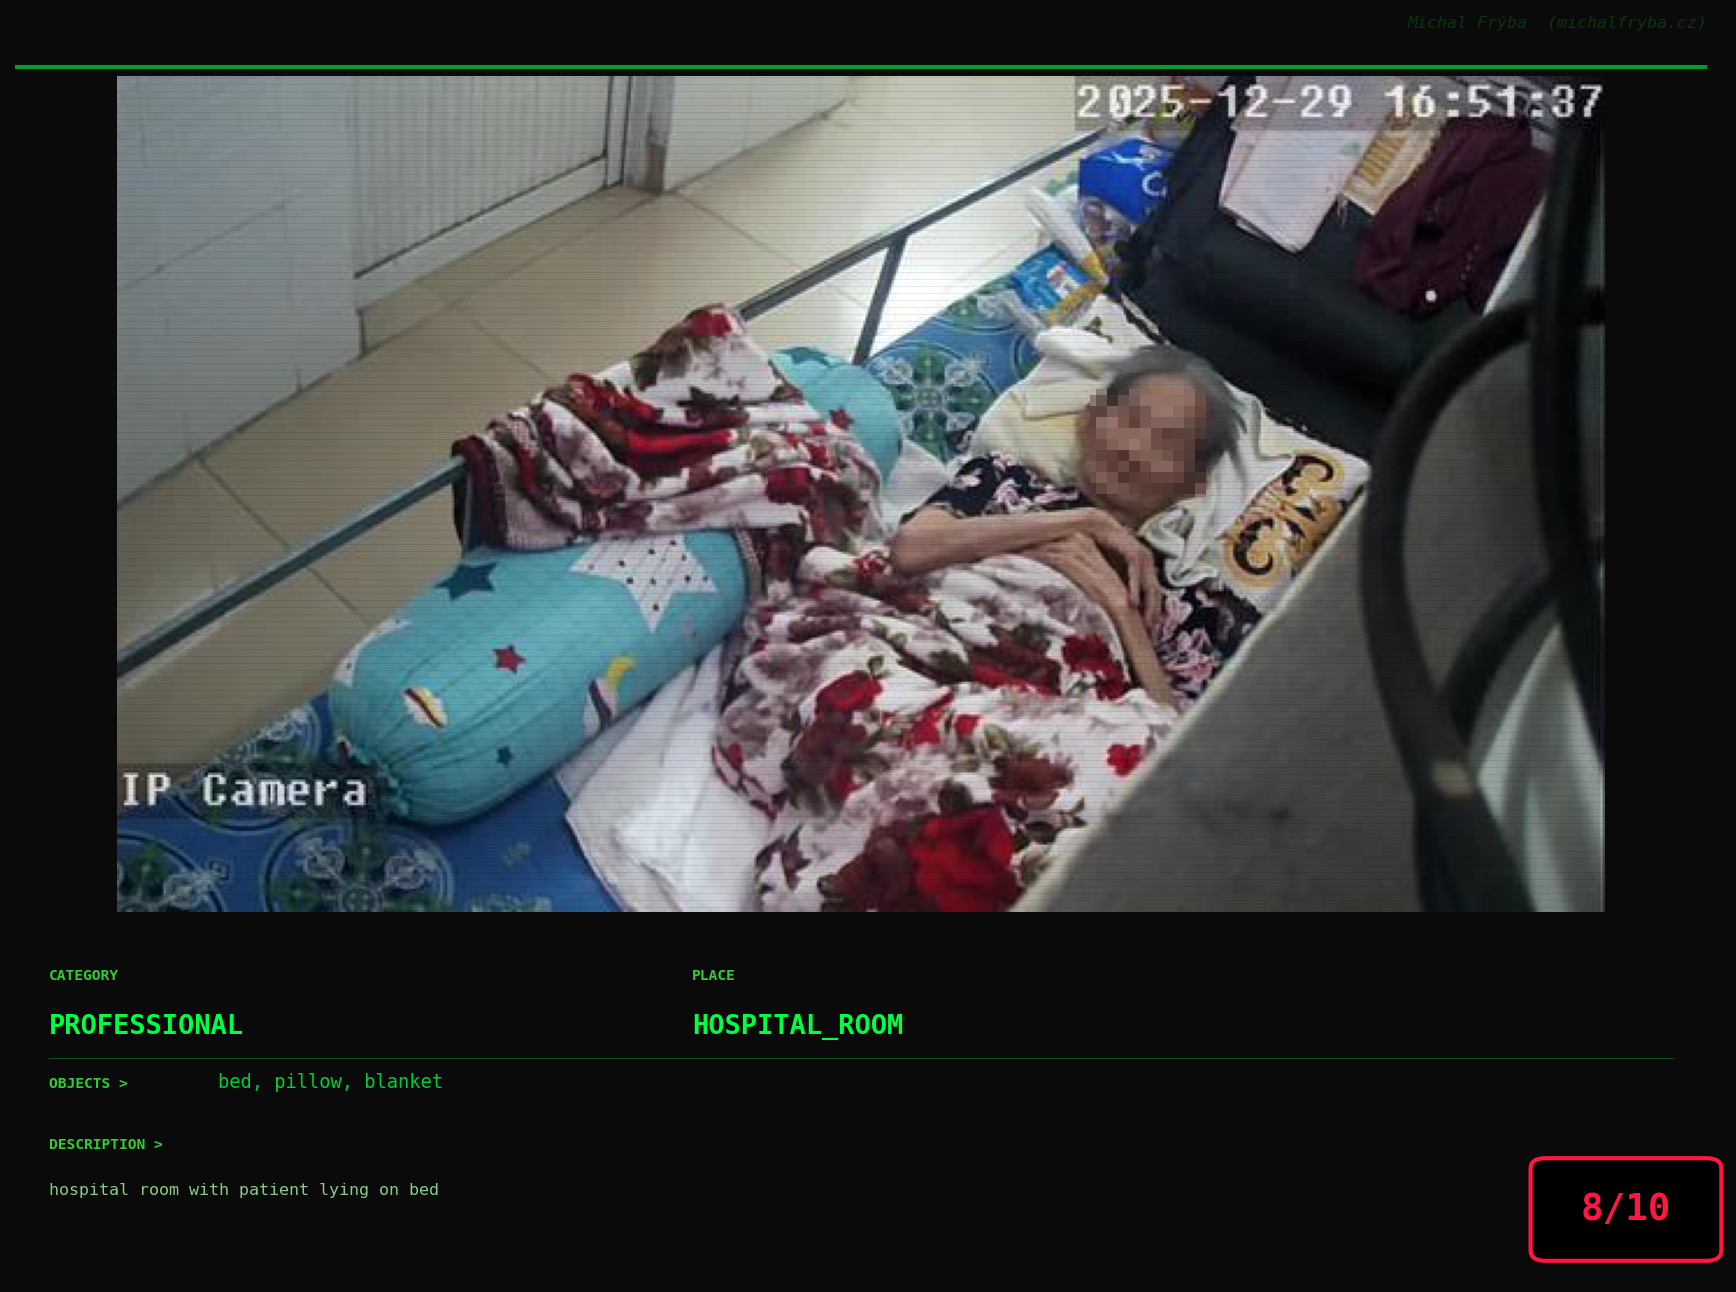
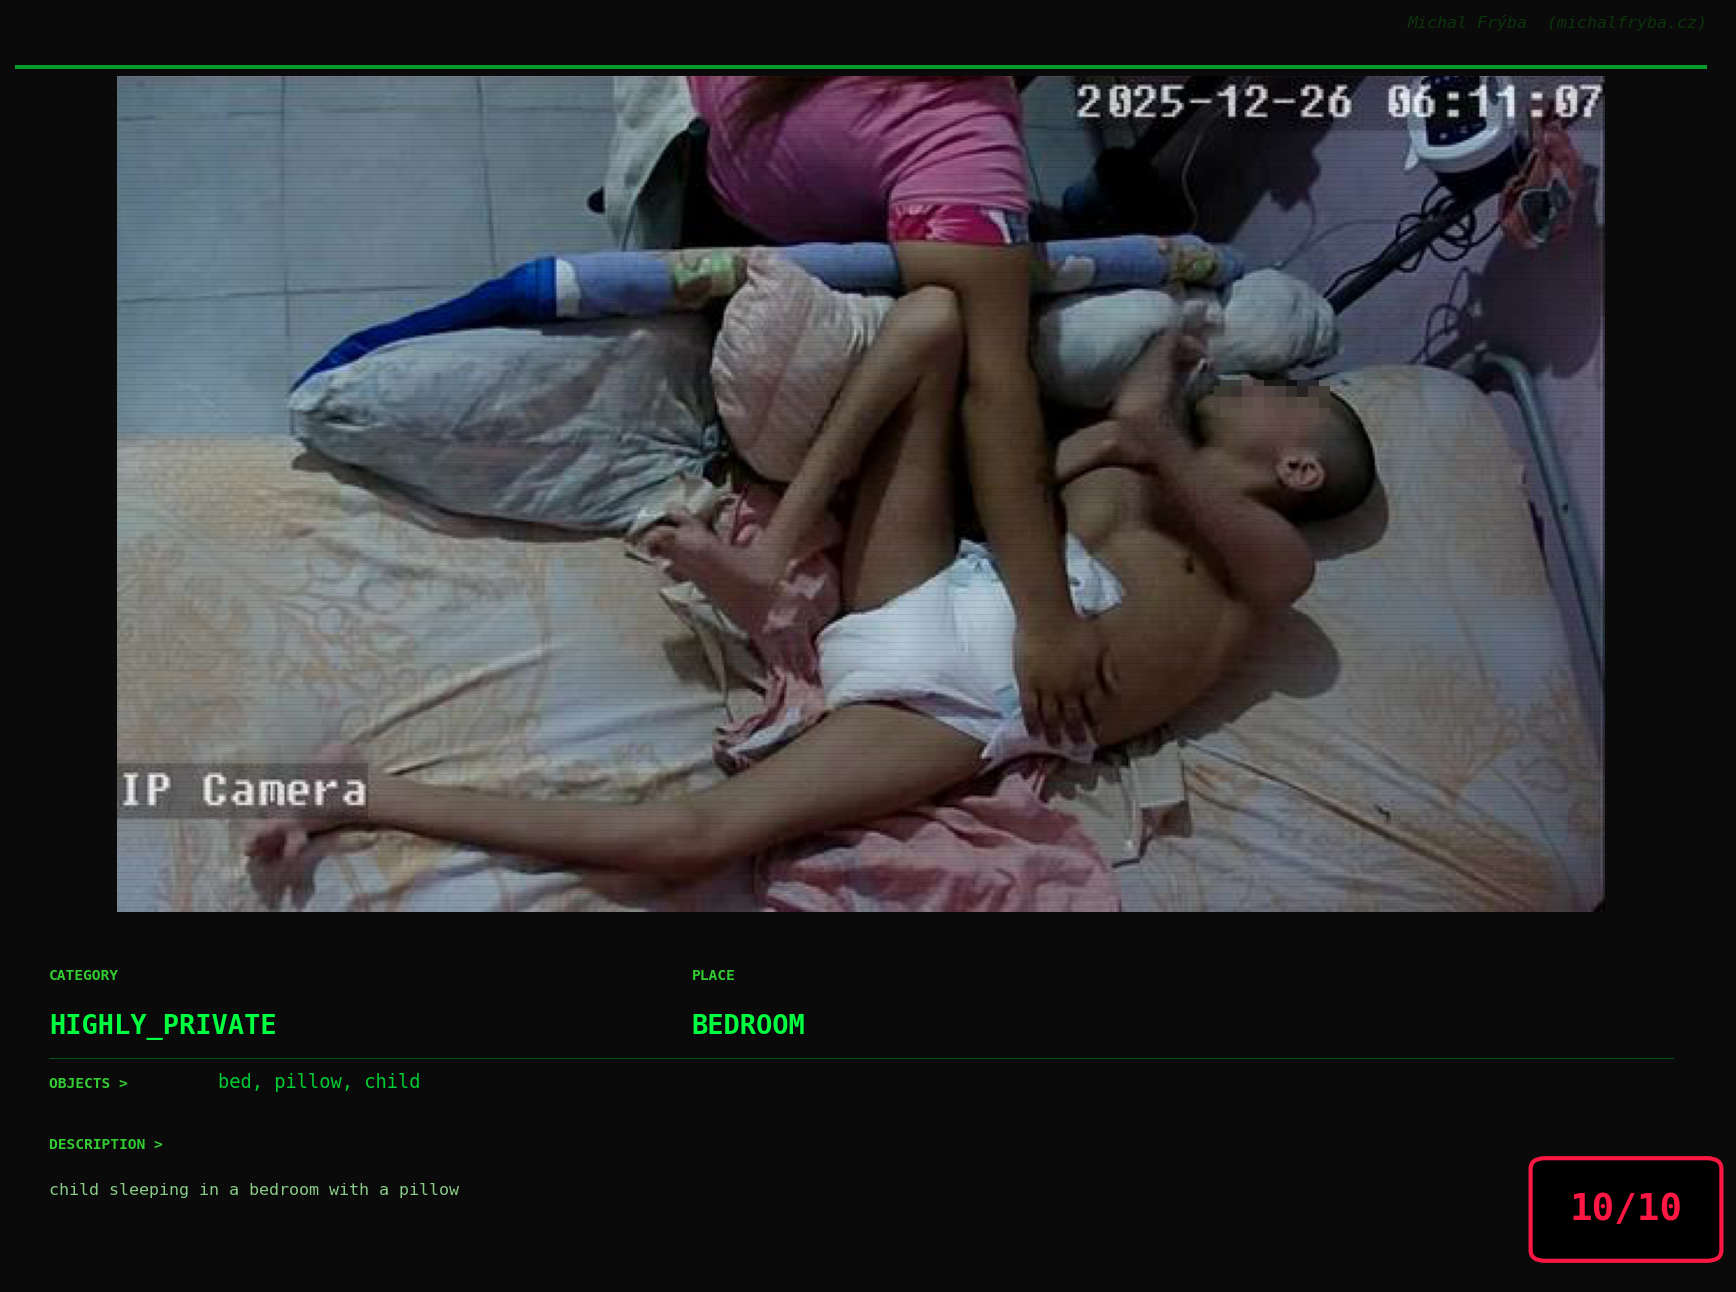
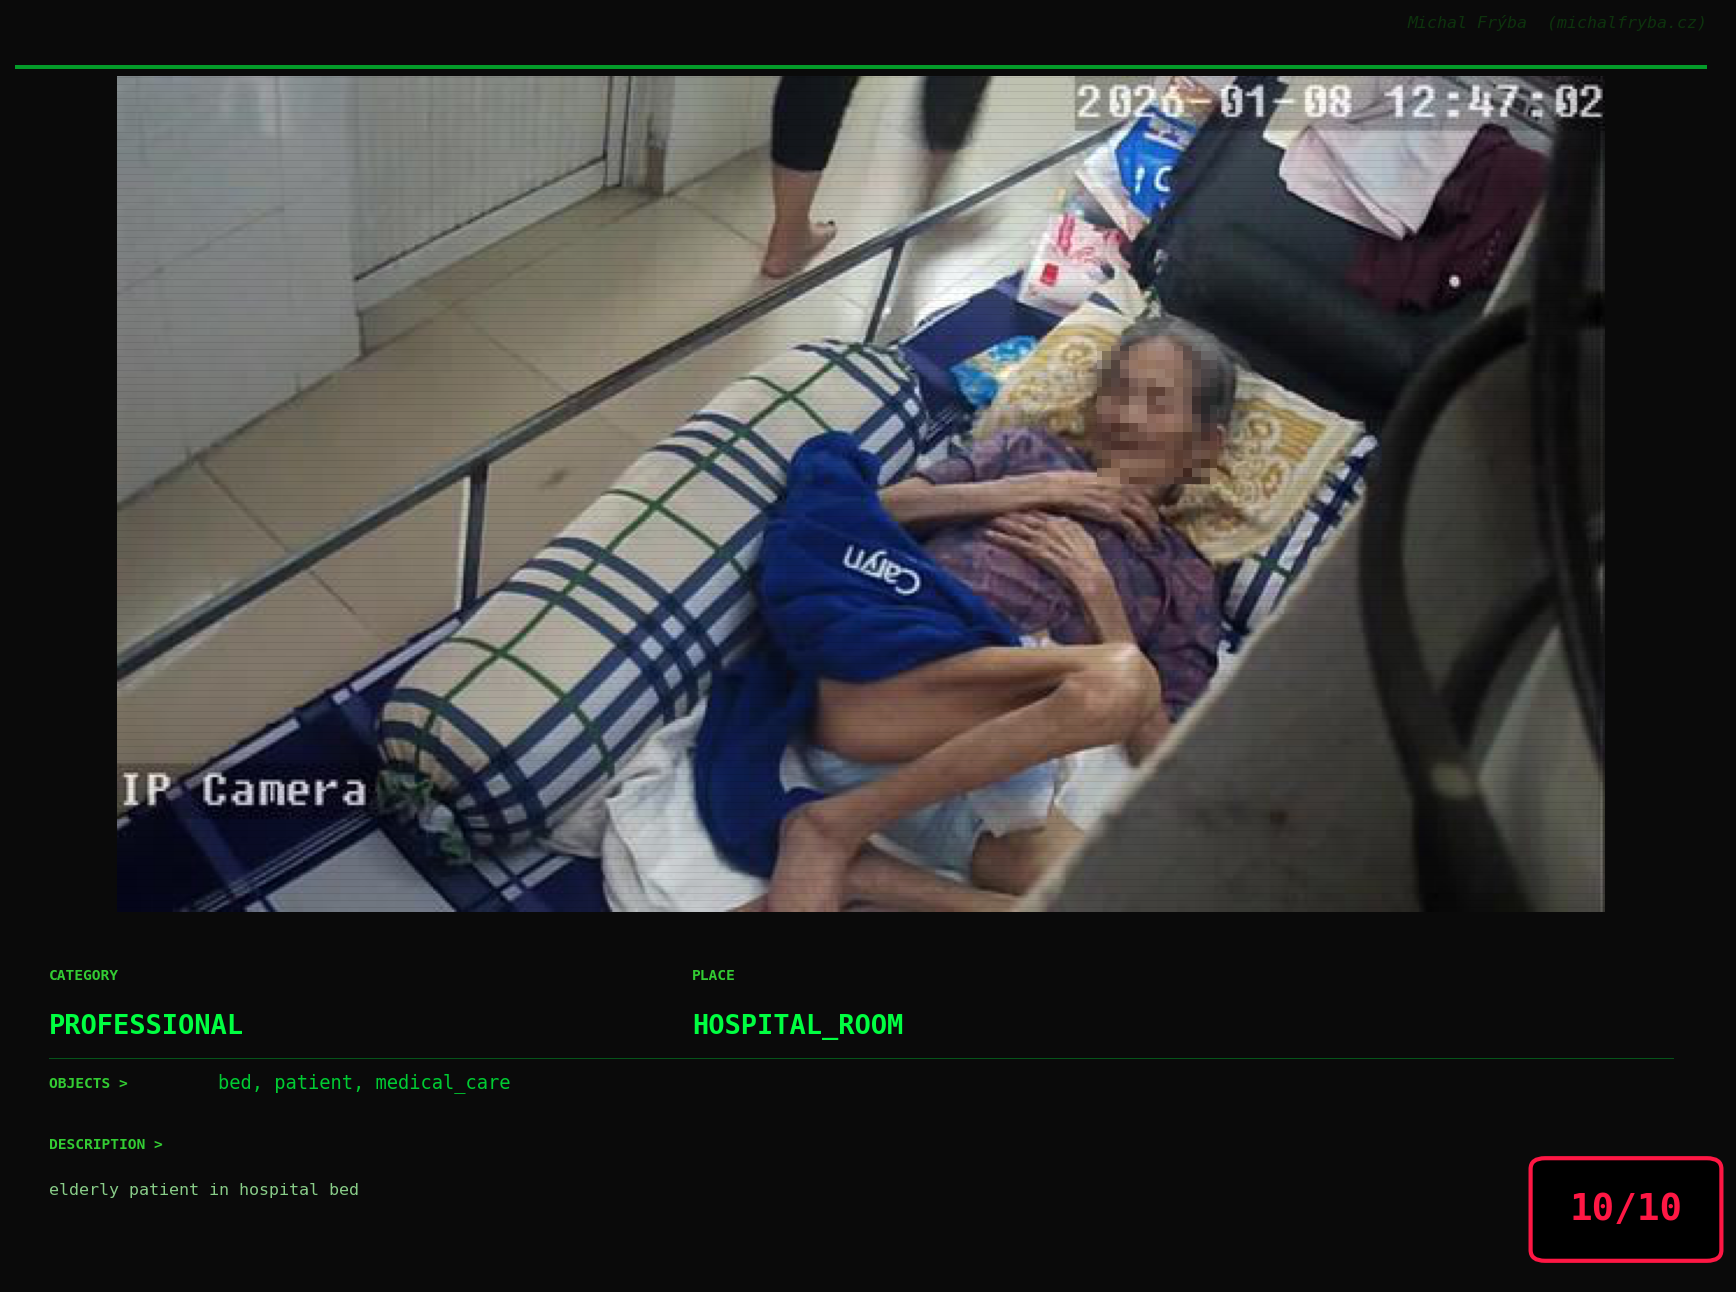
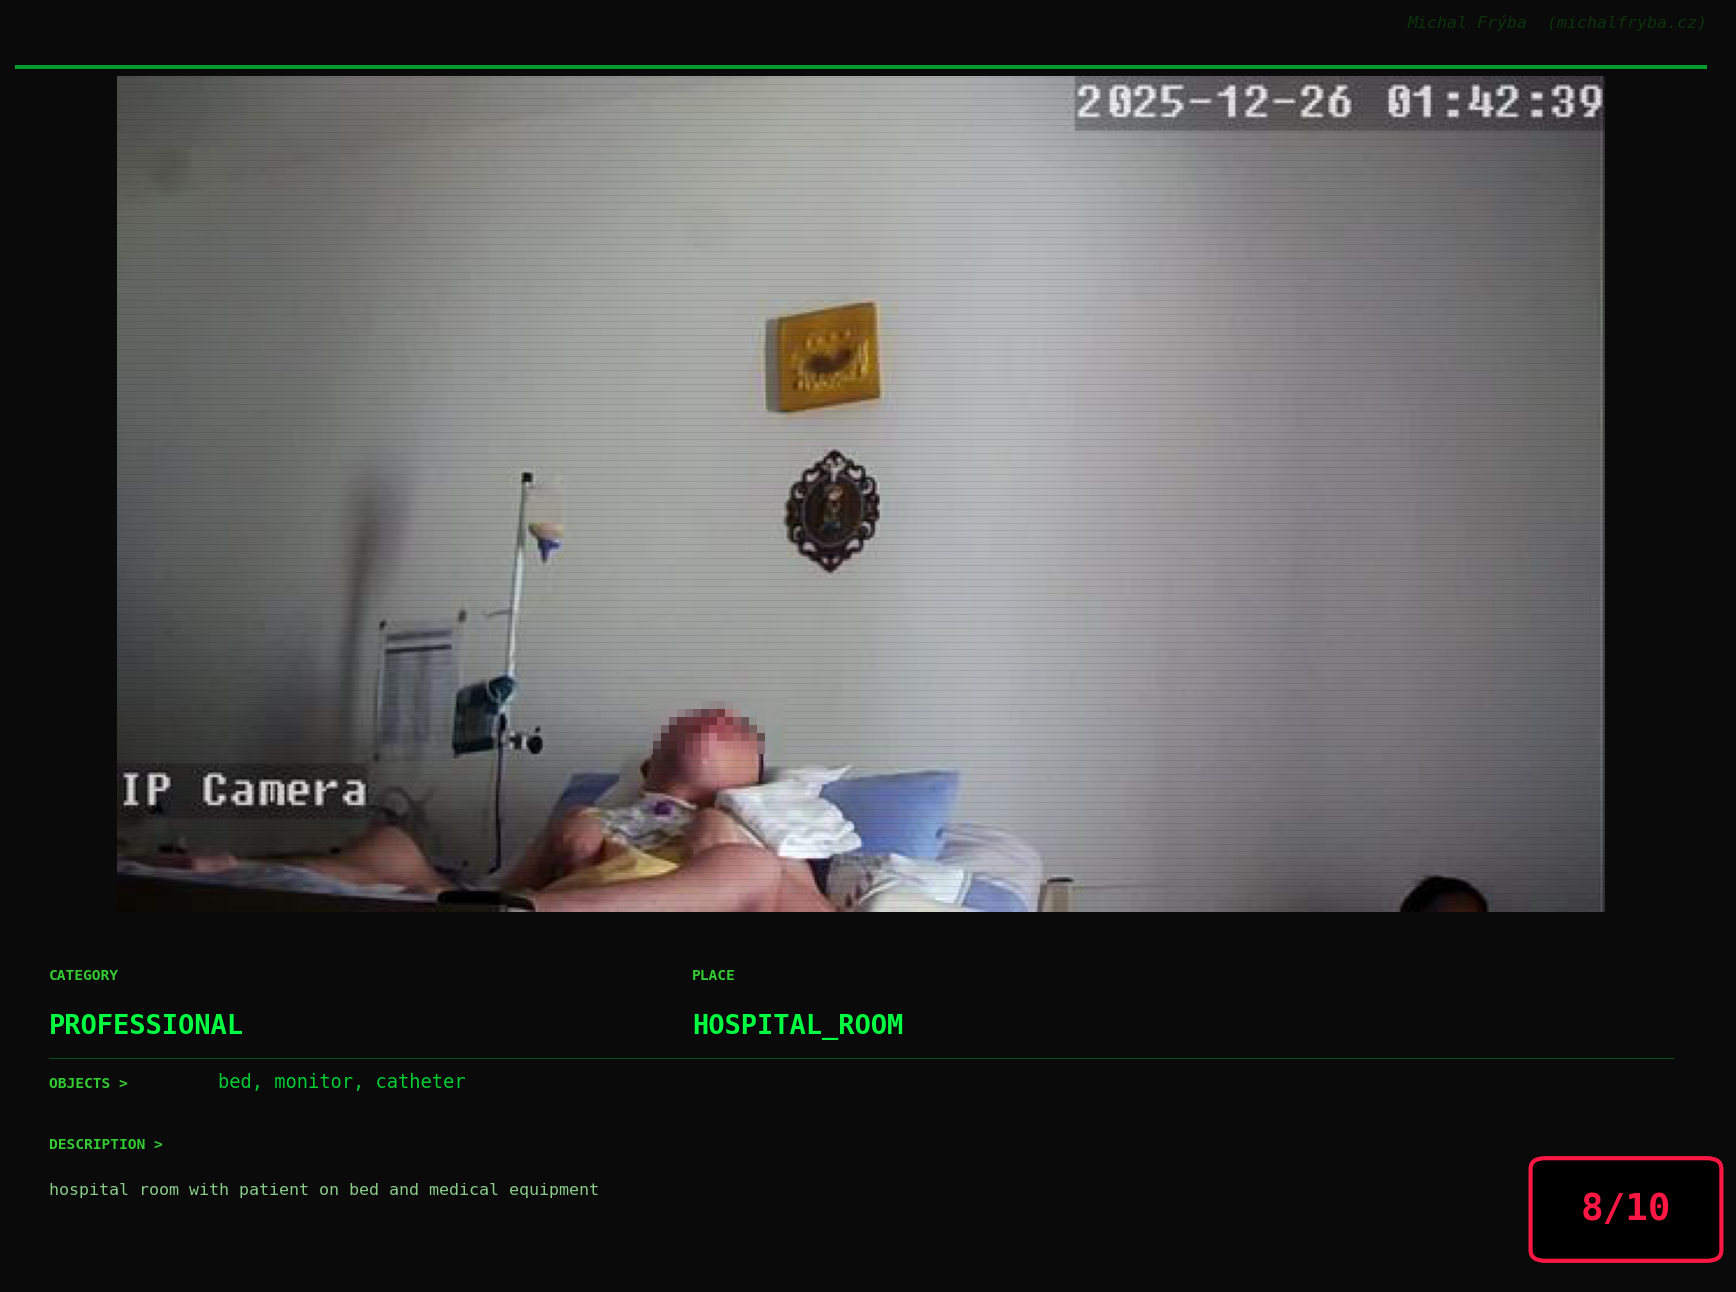
Gallery of Notable Images
At this point, we’ve explored the data from quite a few angles … and the chart count is starting to rival the number of cameras themselves. Rather than adding more graphs, it’s a good moment to step back and highlight some of the most interesting (and occasionally concerning) images found during the analysis. To be honest, a few of these images sit on the darker side of what you’d expect from publicly accessible cameras. In some cases, I even questioned whether they should be included at all. A small number of images were intentionally left out. Not because they weren’t interesting, but because they crossed a line where showing them would defeat the purpose of responsible research. However, one of the main motivations behind this research is raising awareness. These examples highlight how easily cameras can expose private spaces or sensitive situations when deployed without proper security considerations. The goal here isn’t to sensationalize, but to raise awareness that when IoT cameras are deployed without proper security considerations, they can quietly turn private moments into public ones …
On a more serious note, many of the cameras in the following gallery were clearly deployed with good intentions like monitoring property, pets, children, elderly family members, or people with disabilities. However, due to weak or missing security, these same cameras were publicly accessible to anyone. In several cases, they were placed in highly sensitive environments such as bedrooms, bathrooms, hospitals, care facilities, and kindergartens. This highlights a critical privacy risk, when security is overlooked, tools meant to increase safety can unintentionally expose the very people they were meant to protect.
Conclusion
This analysis shows that publicly accessible cameras are not rare edge cases, they are widespread, global, and often unintentionally exposed. Most cameras capture harmless scenes, but a meaningful subset reveals environments that were clearly not meant to be public. The issue is not the technology itself, but how it is deployed.
From a cybersecurity perspective, exposed IoT cameras are a classic example of convenience outweighing security. Default settings, weak authentication, and direct internet exposure create a situation where devices designed for safety can quietly become sources of privacy risk.
Practical Recommendations
To reduce exposure, a few fundamental practices make a significant difference:
- Never expose cameras directly to the internet: use VPNs or secure gateways instead of public access.
- Change default credentials immediately: default usernames and passwords are one of the most common causes of exposure.
- Use network segmentation: place IoT devices on separate networks (VLANs) from critical systems.
- Enable authentication and encryption: avoid unauthenticated streams (e.g., open RTSP).
- Regularly update firmware: many devices run outdated software with known vulnerabilities.
- Disable unused services and ports: reduce the attack surface as much as possible.
- Monitor access logs if available: even basic visibility helps detect unusual activity.
Ultimately, securing IoT devices (including cameras) is not about advanced techniques, but about getting the basics right. Small configuration changes can be the difference between a private system and one that is accessible to anyone on the internet.